Rebuilding Our Infrastructure with Docker, ECS, and Terraform
Oct 7, 2015
By Calvin French-Owen
In Segment’s early days, our infrastructure was pretty hacked together. We provisioned instances through the AWS UI, had a graveyard of unused AMIs, and configuration was implemented three different ways.
As the business started taking off, we grew the size of the eng team and the complexity of our architecture. But working with production was still limited to a handful of folks who knew the arcane gotchas. We’d been improving the process incrementally, but we needed to give our infrastructure a deeper overhaul to keep moving quickly.
So a few months ago, we sat down and asked ourselves: “What would an infrastructure setup look like if we designed it today?”
Over the course of 10 weeks, we completely re-worked our infrastructure. We retired nearly every single instance and old config, moved our services to run in Docker containers, and switched over to use fresh AWS accounts.
We spent a lot of time thinking about how we could make a production setup that’s auditable, simple, and easy to use–while still allowing for the flexibility to scale and grow.
Here’s our solution.
Separate AWS Accounts
Instead of using regions or tags to separate different staging and prod instances, we switched over totally separate AWS accounts. We need to ensure that our provisioning scripts wouldn’t affect our currently running services, and using fresh accounts meant that we had a blank slate to start with.
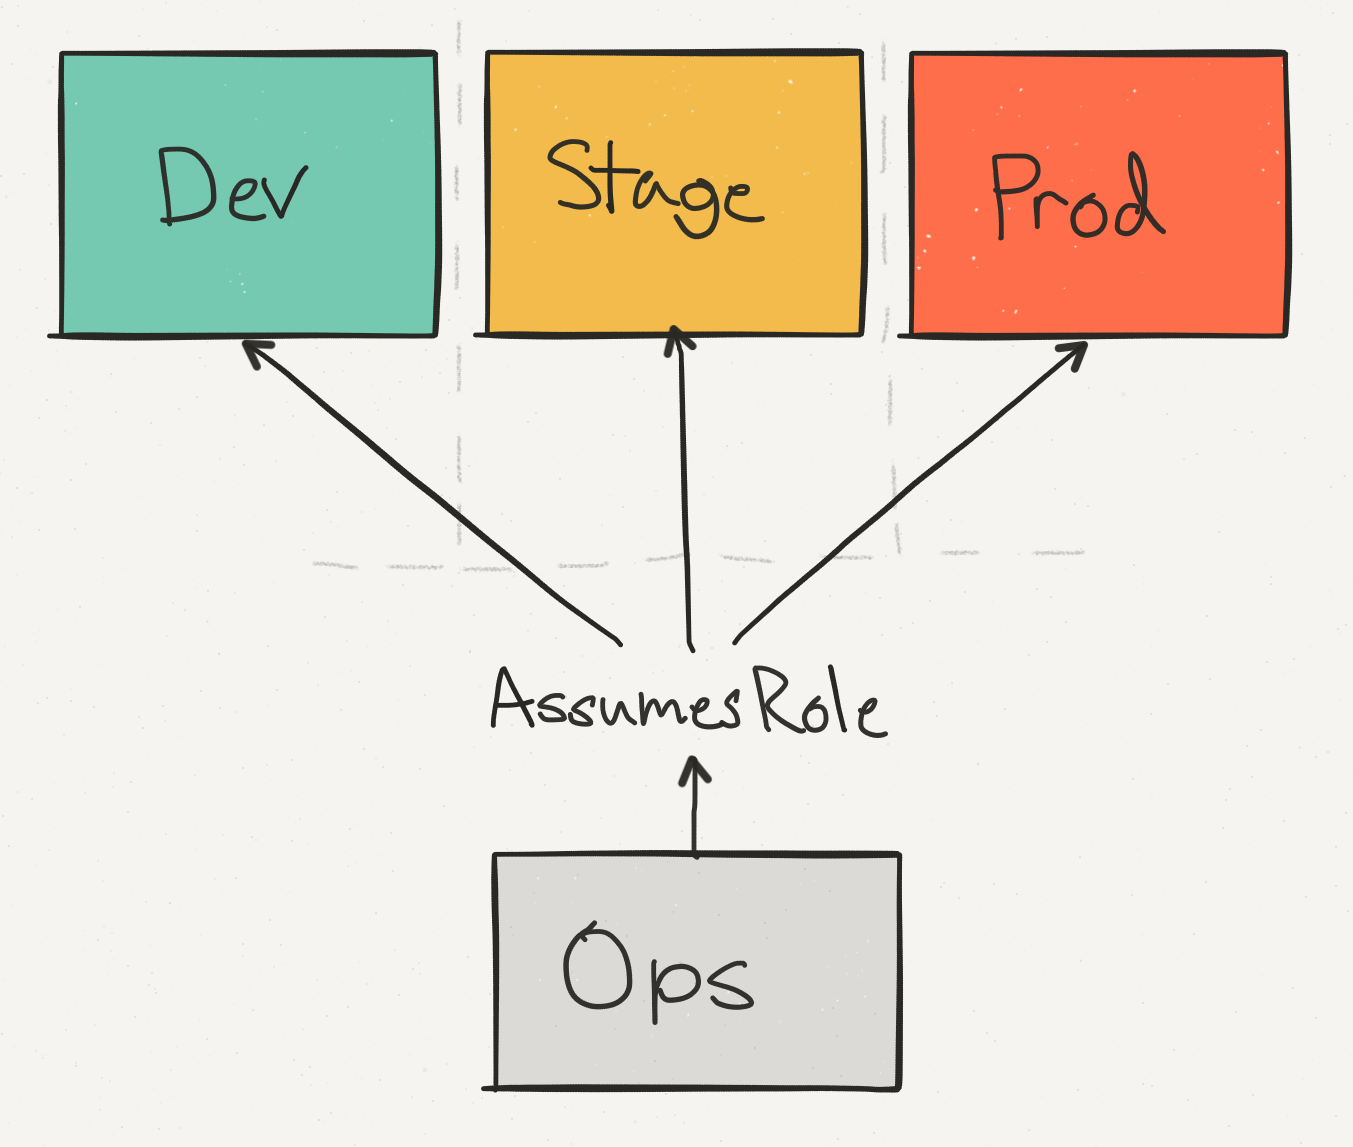
The ops account serves as the jump point and centralized login. Everyone in the organization can have a IAM account for it.
The other environments have a set of IAM roles to switch between them. It means there’s only ever one login point for our admin accounts, and a single place to restrict access.
As an example, Alice might have access to all three environments, but Bob can only access dev (ever since he deleted the production load balancer). But they both enter through the ops account.
Instead of having complex IAM settings to restrict access, we can easily lock down users by environment and group them by role. Using each account from the interface is as simple as switching the currently active role.
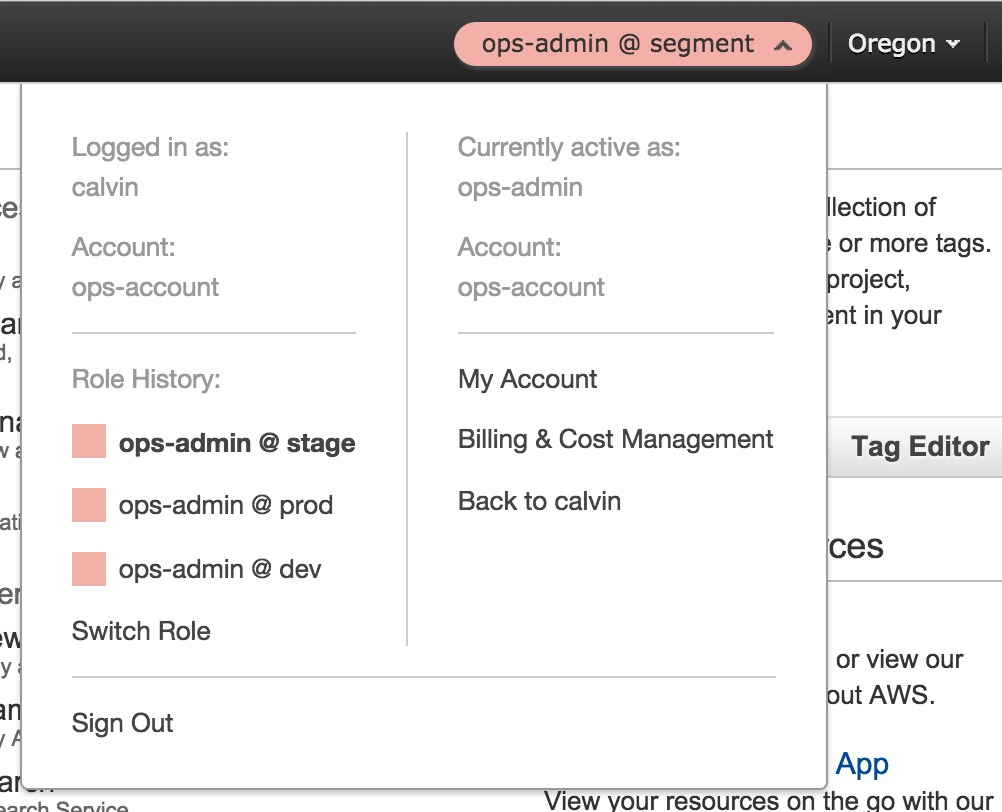
Instead of worrying that a staging box might be unsecured or alter a production database, we get true isolation for free. No extra configuration required.
There’s the additional benefit of being able to share configuration code so that our staging environment actually mirrors prod. The only difference in configuration are the sizes of the instances and the number of containers.
Finally, we’ve also enabled consolidated billing across the accounts. We pay our monthly bill with the same invoicing and see a detailed breakdown of the costs split by environment.
Docker and ECS
Once we had our accounts setup, it was time to architect how services are actually run. And for that, we turned to Docker and the EC2 Container Service (ECS).
As of today, we’re now running the majority of our services inside Docker containers, including our API and data pipeline. The containers receive thousands of requests per second and process 50 billion events every month.
The biggest single benefit of Docker is the extent that it’s empowered the team to build services from scratch. We no longer have a complex set of provisioning scripts or AMIs—we just hand the production cluster an image, and it runs. There’s no more stateful instances, and we’re guaranteed to run the same exact code on both staging and prod.
After configuring our services to run in containers, we chose ECS as the scheduler.
At a high level, ECS is responsible for actually running our containers in production. It takes care of scheduling services, placing them on separate hosts, and zero-downtime reloads when attached to an ELB. It can even schedule across AZs for better availability. If a container dies, ECS will make sure it’s re-scheduled on a new instance within that cluster.
The switch to ECS has vastly simplified running a service without needing to worry about upstart jobs or provisioning instances. It’s as easy as adding a Dockerfile, setting up the task definition, and associating it with a cluster.
In our setup, the Docker images are built by CI, and then pushed to Docker Hub. When a service boots up, it pulls the image from Docker Hub, and then ECS schedules it across machines.
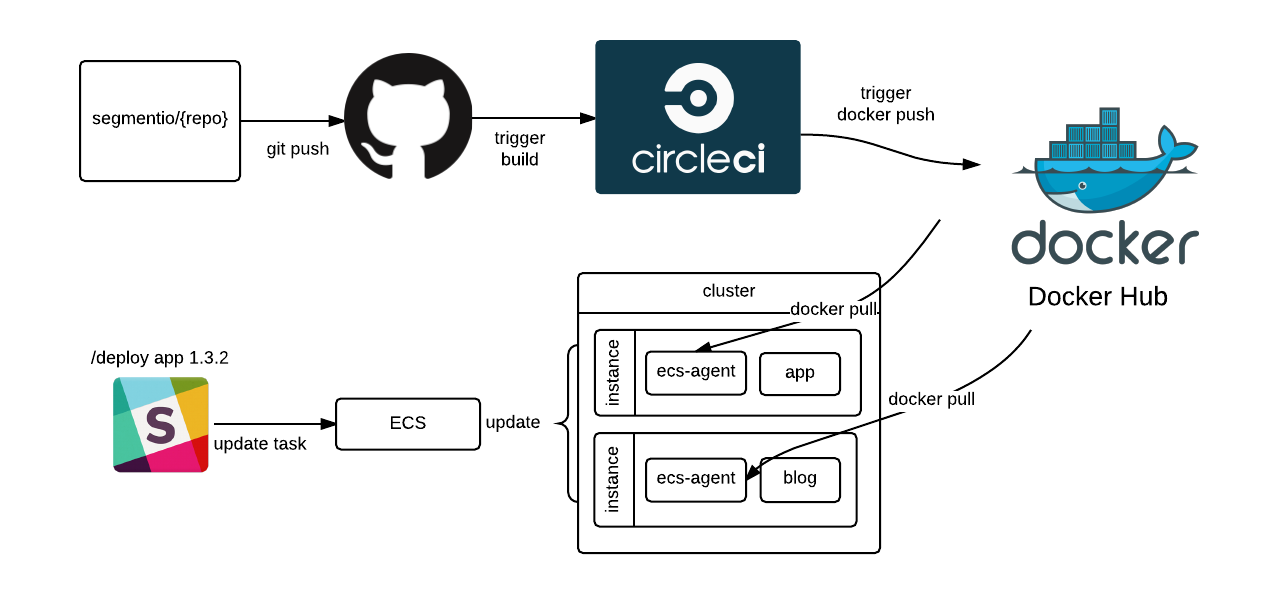
We group our service clusters by their concern and load profile (e.g. different clusters for API, CDN, App, etc). Having separate clusters means that we get better visibility and can decide to use different instance types for each (since ECS has no concept of instance affinity).
Each service has a particular task definition indicating which version of the container to run, how many instances to run on, and which cluster to choose.
During operation, the service registers itself with an ELB and uses a healthcheck to confirm that the container is actually ready to go. We point a local Route53 entry at the ELB, so that services can talk to each other and simply reference via DNS.
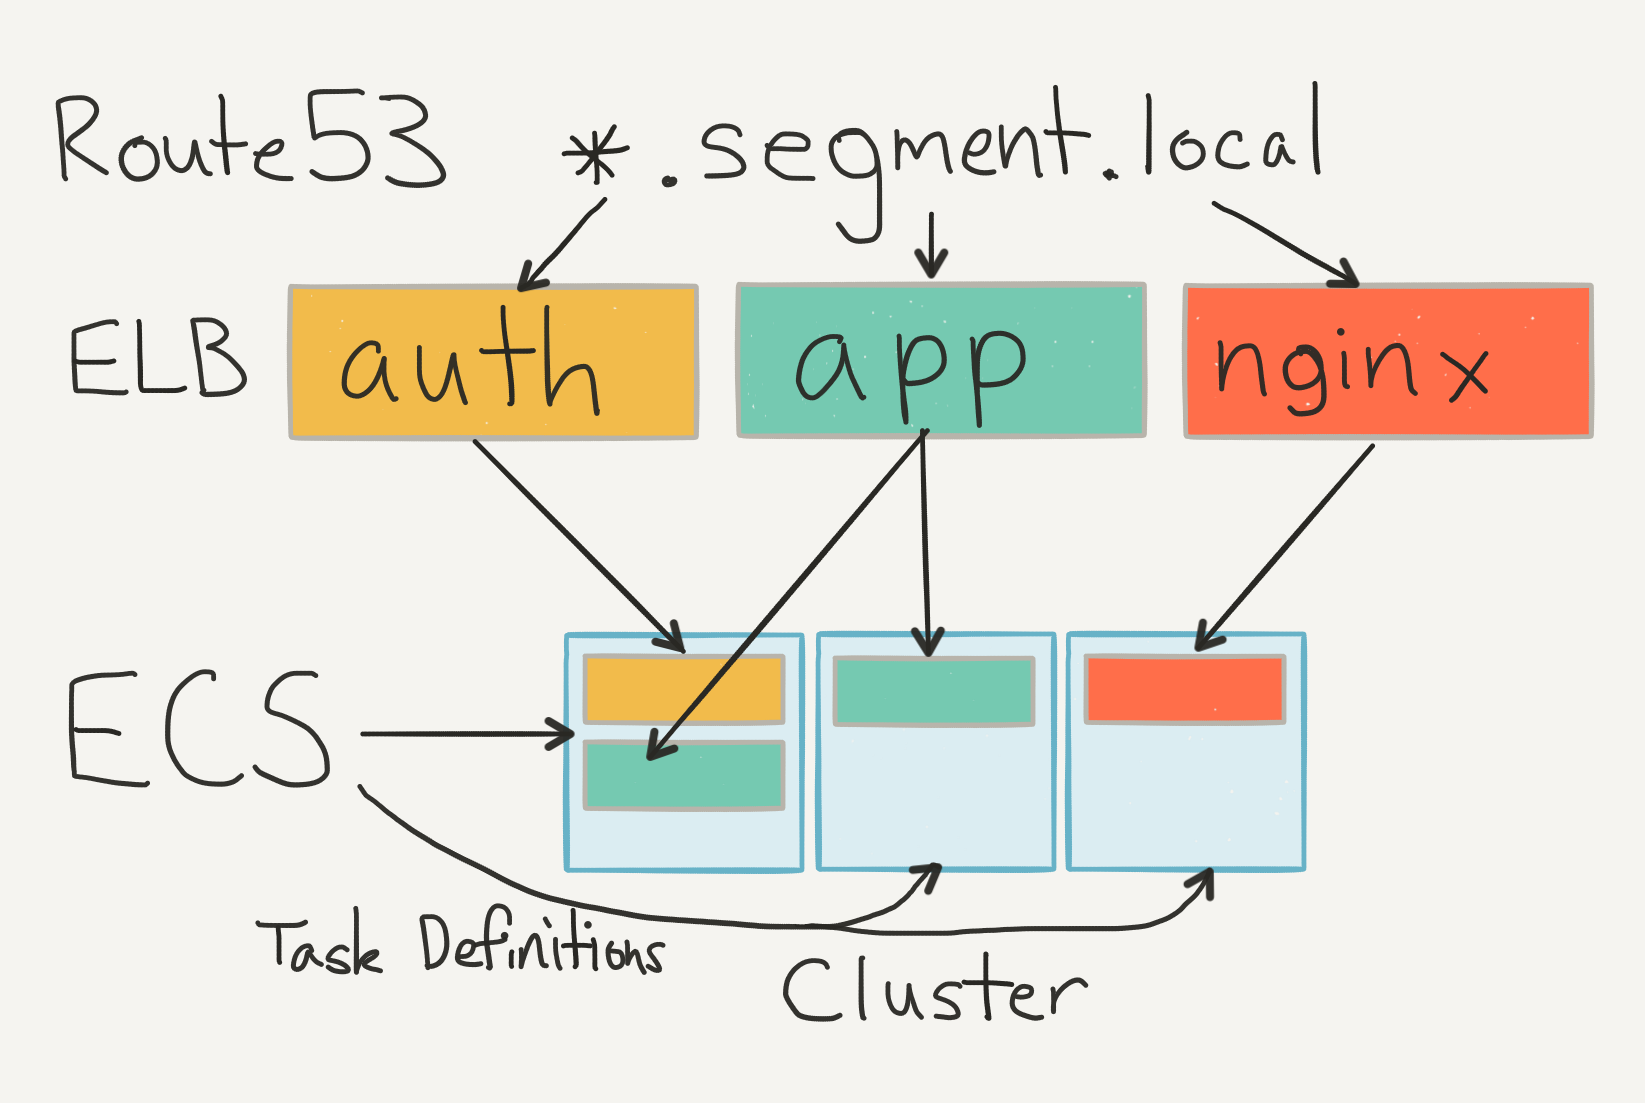
The setup is nice because we don’t need any service discovery. The local DNS does all the bookkeeping for us.
ECS runs all the services and we get free cloudwatch metrics from the ELBs. It’s been a lot simpler than having to register services with a centralized authority at boot-time. And the best part is that we don’t have to deal with state conflicts ourselves.
Templating with Terraform
Where Docker and ECS describe how to run each of our services, Terraform is the glue that holds them together. At a high level, it’s a set of provisioning scripts that create and update our infrastructure. You can think of it like a version of Cloudformation on steroids–but it doesn’t make you want to poke your eyes out.
Rather than running a set of servers for maintaining state, there’s just a set of scripts that describe the cluster. Configuration is run locally (and in the future, via CI) and committed to git, so we have a continuous record of what our production infrastructure actually looks like.
Here’s an sample of our Terraform module for setting up our bastion nodes. It creates all the security groups, instances, and AMIs, so that we’re able to easily set up new jump points for future environments.
We use the same module in both stage and prod to set up our individual bastions. The only thing we need to switch out are the IAM keys, and we’re ready to go.
Making changes is also painless. Instead of always tearing down the entire infrastructure, Terraform will make updates where it can.
When we wanted to change our ELB draining timeout to 60 seconds, it took a simple find/replace followed by a terraform apply. And voilà, two minutes later we had a fully altered production setup for all of our ELBs.
It’s reproduceable, auditable, and self-documenting. No black boxes here.
We’ve put all the config in a central infrastructure repo, so it’s easy to discover how a given service is setup.
We haven’t quite reached the holy grail yet though. We’d like to convert more of our Terraform config to take advantage of modules so that individual files can be combined and reduce the amount of shared boilerplate.
Along the way we found a few gotchas around the .tfstate, since Terraform always first reads from the existing infrastructure and complains if the state gets out of sync. We ended up just committing our .tfstate to the repo, and pushing it after making any changes, but we’re looking into Atlas or applying via CI to solve that problem.
Moving to Datadog
By this point, we had our infrastructure, our provisioning, and our isolation. The last things left were metrics and monitoring to keep track of everything running in production.
In our new environment, we’ve switched all of our metrics and monitoring over to Datadog, and it’s been fantastic.
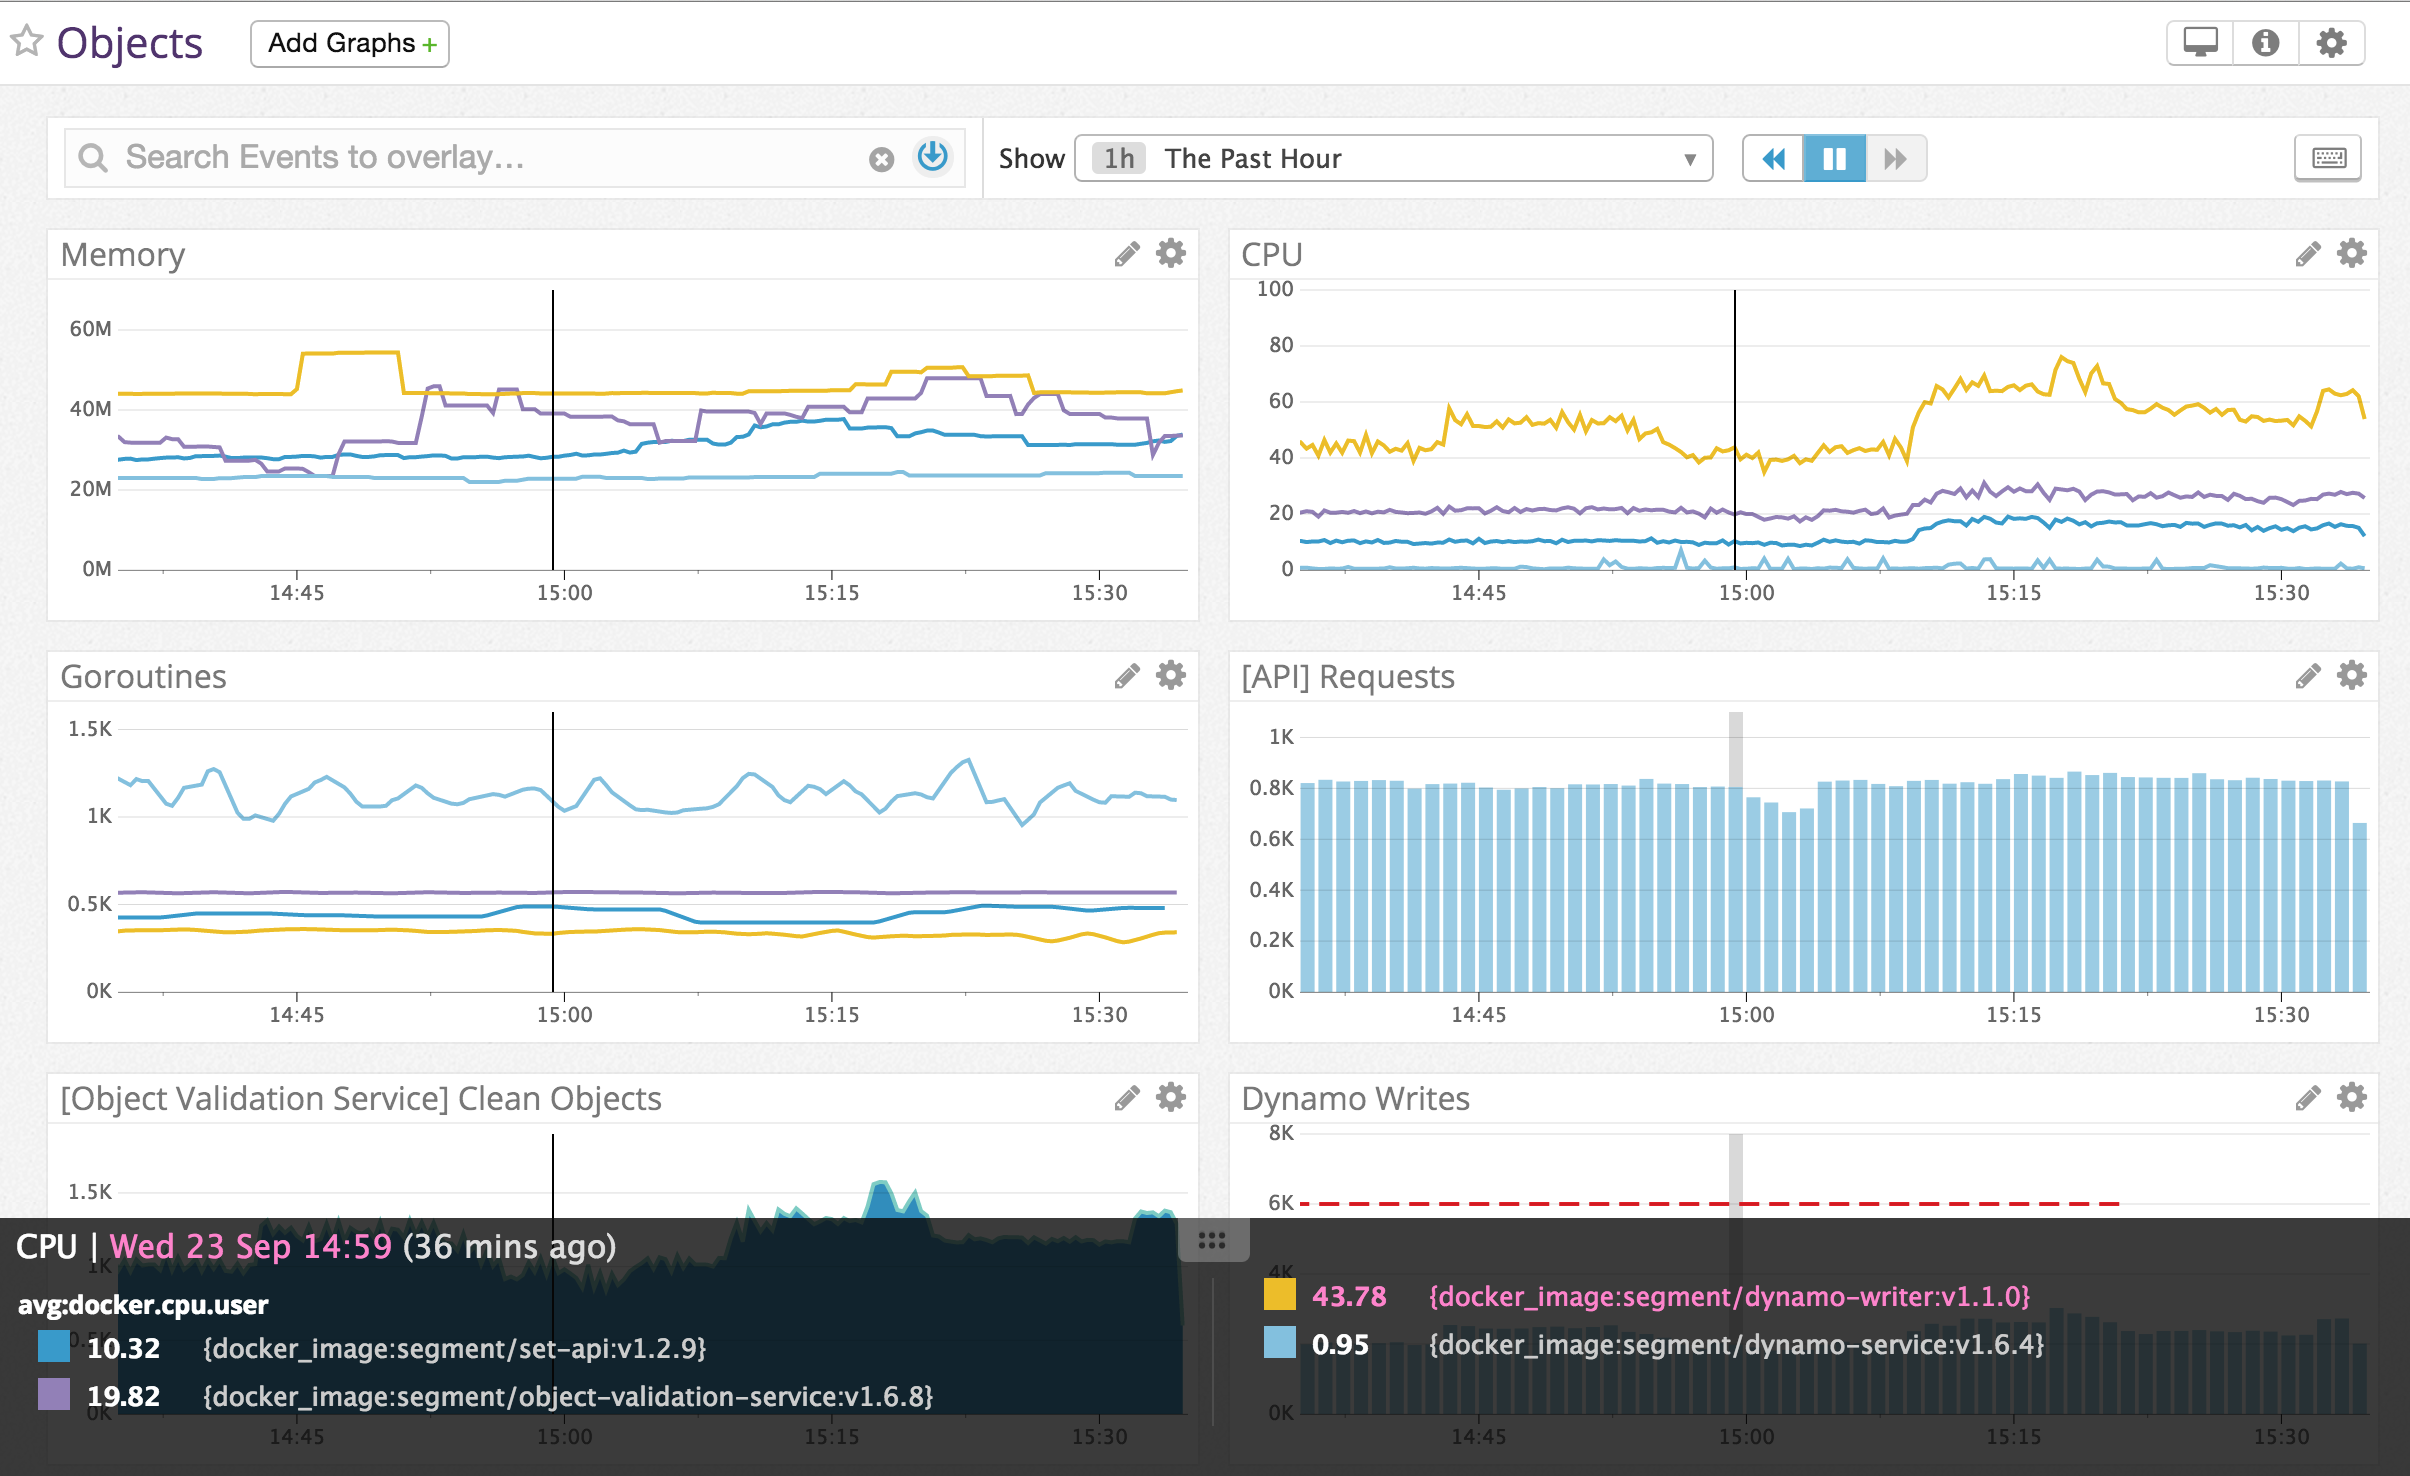
We’ve been incredibly happy with Datadog’s UI, API, and complete integration with AWS, but getting the most out of the tool comes from a few key pieces of setup.
The first thing we did was integrate with AWS and Cloudtrail. It gives a 10,000 foot view of what’s going on in each of our environments. Since we’re integrating with ECS, the Datadog feed updates everytime a task definition updates, so we end up getting notifications for deploys for free. Searching the feed is surprisingly snappy, and makes it easy to trace down the last time a service was deployed or rescheduled.
Next, we made sure to add the Datadog-agent as a container to our base AMI (datadog/docker-dd-agent). It not only gathers metrics from the host (CPU, Memory, etc) but also acts as a sink for our statsd metrics. Each of our services collects custom metrics on queries, latencies, and errors so that we can explore and alert on the in Datadog. Our go toolkit (soon to be open sourced) automatically collects the output of pprof on a ticker and sends it as well, so we can monitor memory and goroutines.
What’s even cooler is that the agent can visualize instance utilization across hosts in the environment, so we can get a high level overview of instances or clusters which might be having issues:

Additionally, my teammate Vince created a Terraform provider for Datadog, so we can completely script our alerting against the actual production configuration. Our alerts will be recorded and stay in sync with what’s running in prod.
By convention, we specify two alert levels: warning and critical. The warning is there to let anyone currently online know that something looks suspicious and should be triggered well in advance of any potential problems. The criticalalerts are reserved for ‘wake-you-up-in-the-middle-of-the-night’ problems where there’s a serious system failure.
What’s more, once we transition to Terraform modules and add the Datadog provider to our service description, then all services end up getting alerts for free. The data will be powered directly by our internal toolkit and Cloudwatch metrics.
Let the good times docker run
Once we had all these pieces in place, the day had finally come to make the switch.
We first set up a VPC peering connection between our new production environment and our legacy one–allowing us to cluster databases and replicate across the two.
Next, we pre-warmed the ELBs in the new environment to make sure that they could handle the load. Amazon won’t provision automatically sized ELBs, so we had to ask them to ramp it ahead of time (or slowly scale it oursleves) to deal with the increased load.
From there, it was just a matter of steadily ramping up traffic from our old environment to our new one using weighted Route53 routes, and continuously monitoring that everything looked good.
Today, our API is humming along, handling thousands of requests per second and running entirely inside Docker containers.
But we’re not done yet. We’re still fine-tuning our service creation, and reducing the boilerplate so that anyone on the team can easily build services with proper monitoring and alerting. And we’d like to improve our tooling around working with containers, since services are no longer tied to instances.
We also plan to keep an eye on promising tech for this space. The Convox team is building awesome tooling around AWS infrastructure. Kubernetes, Mesosphere, Nomad, and Fleet seemed like incredibly cool schedulers, though we liked the simplicity and integration of ECS. It’s going to be exciting to see how they all shake out, and we’ll keep following them to see what we can adopt.
After all of these orchestration changes, we believe more strongly than ever in outsourcing our infrastructure to AWS. They’ve changed the game by productizing a lot of core services, while maintaining an incredibly competitive price point. It’s creating a new breed of startups that can build products efficiently and cheaply while spending less time on maintenance. And we’re bullish on the tools that will be built atop their ecosystem.
The State of Personalization 2023
Our annual look at how attitudes, preferences, and experiences with personalization have evolved over the past year.
Get the report
The State of Personalization 2023
Our annual look at how attitudes, preferences, and experiences with personalization have evolved over the past year.
Get the report
Share article
Recommended articles
How to accelerate time-to-value with a personalized customer onboarding campaign
To help businesses reach time-to-value faster, this blog explores how tools like Twilio Segment can be used to customize onboarding to activate users immediately, optimize engagement with real-time audiences, and utilize NPS for deeper customer insights.
Introducing Segment Community: A central hub to connect, learn, share and innovate
Dive into Segment's vibrant customer community, where you can connect with peers, gain exclusive insights, and elevate your success with expert guidance and resources!
Using ClickHouse to count unique users at scale
By implementing semantic sharding and optimizing filtering and grouping with ClickHouse, we transformed query times from minutes to seconds, ensuring efficient handling of high-volume journeys in production while paving the way for future enhancements.