
In this recipe, you’ll learn how to monitor your Segment workspace using Public API.
The goal of observability involves:
Proactively understand event volume and % of events successfully sent to destinations.
Reactively identify issues, report on common errors, and average latency.
Segment’s user interface provides an Event Delivery feature to help you understand how your data is reaching your destinations, including events that are not being delivered. Our Event Delivery feature is always a valuable tool to drill down into specific Workspace issues!
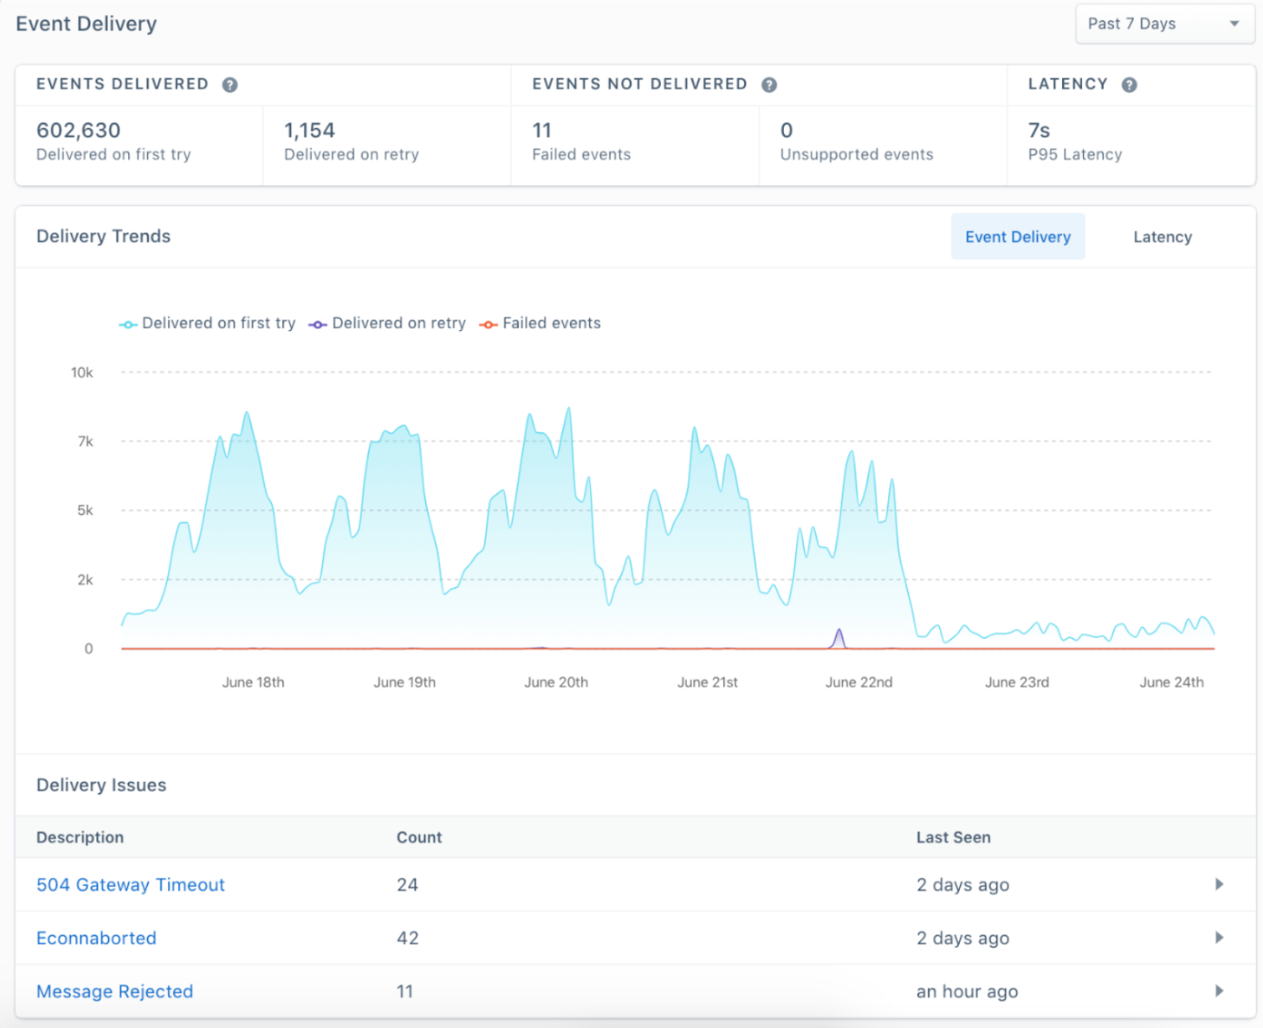
However, engineering teams often have centralized observability such as DataDog, Grafana, or their data warehouse. While Event Delivery in the Segment app is useful for specific destinations and drill downs, centralizing observability becomes especially important as you grow with various business units, regions, and test environments that require scaling to a large number of connections and multiple Workspaces. In addition, Segment Public API provides an Events Volume endpoint that summarizes the number of events being sent to your Sources, regardless of their delivery status to Destinations. You can achieve this centralization by using our Public API. Our Delivery Metrics Summary and Events Volume endpoint is one of our most commonly-used endpoints!
Important considerations
Public API is available for Team and all Business plans
Make sure Segment is activating data to your destinations prior to this recipe
If you have separate Workspaces for testing and for production, implement in test first!
Step 1: Set up a Public API Token and Test the API
Start by navigating to Access Management:

Select Roles associated with the Token in order to limit access. In many cases, a Workspace Owner that has full access is sufficient, but you can also limit access to specific Roles:

You’re all set with your bearer token:

Step 2: Pick a Source and its connected Destinations
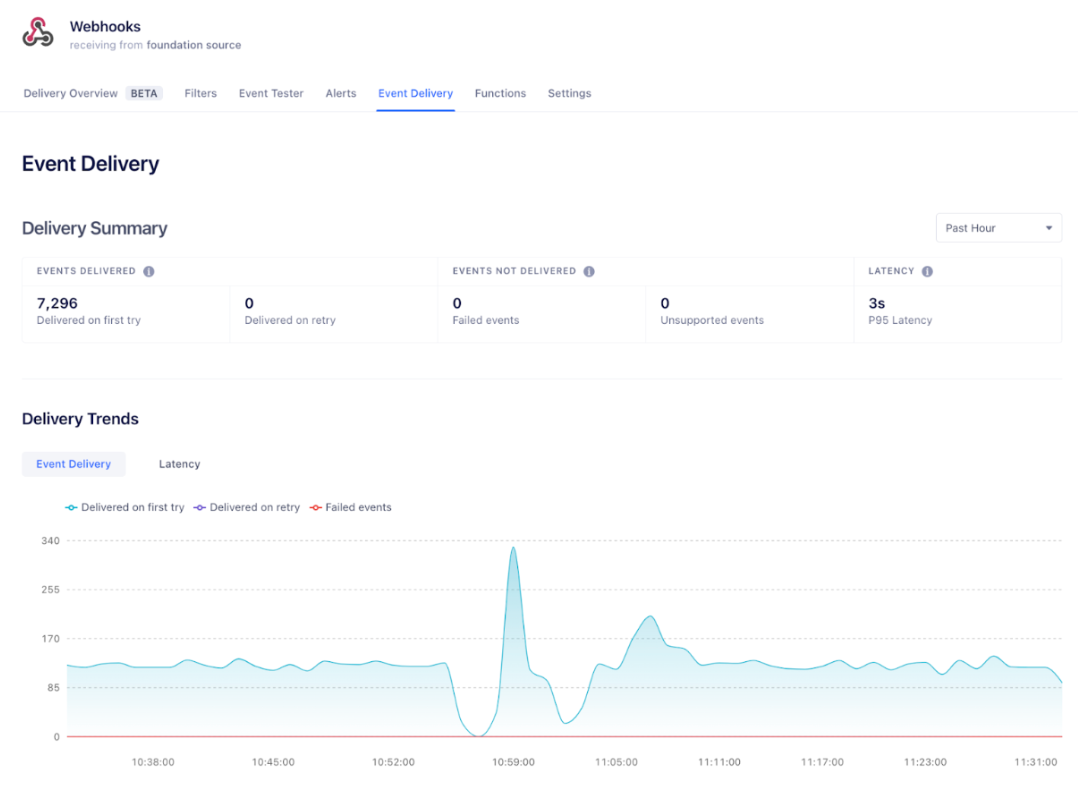
The first 2 required parameters are your desired Destination and associated Source to track delivery metrics for. You can always check a specific Destination and its Event Delivery metrics directly from the Segment UI:
TIP: Using the List Connected Destinations from Source API, you can export in JSON all of your Destinations connected to a specific Source, and the associated Ids required when requesting Delivery Metrics.
This is a simpler approach than listing all Sources and Destinations independently.
curl --location --globoff 'https://api.segmentapis.build/sources?pagination[count]=200&pagination[cursor]=current' \
--header 'Authorization: Bearer #REDACTED#'
Step 3: Define granularity parameter for your Delivery Metrics
Delivery metrics provided by Public API will be aggregated based on a time increment of your preference. The granularity to filter metrics to. This is an optional parameter that defaults to minute if not set.
For example, this request defines the granularity as HOUR.
curl --location 'https://api.segmentapis.build/destinations/600792df162748f0ee76204f/delivery-metrics?sourceId=33YZrvDvRFRBcMhqSZzTF3&startTime=2023-07-29T00%3A00%3A00Z&endTime=2023-07-31T00%3A00%3A00Z&granularity=HOUR' \
--header 'Authorization: Bearer #REDACTED#'
Filtering by Hour generally provides enough granularity to catch abnormalities within 24 hours without managing a high number of APIs involved in summarizing by Minute. We support minutes to help you catch abnormal spikes in usage in order to mitigate issues closer to real time.
Based on the granularity chosen, there are restrictions on the time range you can query. Notice that the max time range varies based on the granularity. If the time range is not supported, you will receive an error message, such as:
{
  "errors": [
    {
      "type": "bad-request",
      "message": "Invalid date/time range '2023-07-29T00:00:00.000Z'-'2023-07-31T00:00:00.000Z'. Granularity 'MINUTE' does not accept range over 4 hours."
    }
  ]
}
Minute:
Max time range: 4 hours
Oldest possible start time: 48 hours in the past
Hour:
Max Time range: 7 days
Oldest possible start time: 7 days in the past
Day:
Max time range: 14 days
Oldest possible start time: 14 days in the past
Step 4: Submit your GET Request for Delivery Metrics Summary
Now you’re ready to submit your API request to list Delivery Metrics Summary from a Destination. Example request with both your desired Destination and Source Id:
curl --location 'https://api.segmentapis.build/destinations/640fab50599d28f9f2fe09f1/delivery-metrics?sourceId=3os4ggvDZ9A2FVduTp7BLv' \
--header 'Authorization: Bearer #REDACTED#'
In addition to the Source Id, you can specify the following optional parameters:
QUERY PARAMETERS
sourceId (required): string (endTime)
Filter events that happened before this time. Defaults to now if not set. This parameter exists in beta.
startTime: string (startTime)
Filter events that happened after this time. Defaults to:
1 hour ago if granularity is MINUTE. 7 days ago if granularity is HOUR. 30 days ago if granularity is DAY. This parameter exists in beta.
endTime: string (endTime)
Filter events that happened before this time. Defaults to now if not set. This parameter exists in beta.
granularity: string (granularity)
The granularity to filter metrics to. Either MINUTE, HOUR or DAY. Defaults to MINUTE if not set. This parameter exists in beta. Enum: "DAY" "HOUR" "MINUTE"
Step 5: Understanding your response
The data that is returned can be easily visualized through the Event Deliver user interface directly in Segment.

Example request
curl --location 'https://api.segmentapis.build/destinations/61de704d8ba501388847f3f5/delivery-metrics?sourceId=e2wdQQGhujzzXEsMHDH5od&startTime=2023-08-01T00%3A00%3A00Z&endTime=2023-08-05T00%3A00%3A00Z&granularity=HOUR' \
--header 'Authorization: Bearer #REDACTED#'
Example JSON response (some content removed for brevity)
{
  "data": {
    "deliveryMetricsSummary": {
      "sourceId": "e2wdQQGhujzzXEsMHDH5od",
      "destinationMetadataId": "614a3c7d791c91c41bae7599",
      "metrics": [
        {
          "metricName": "successes",
          "total": 259216,
          "breakdown": [
            {
              "metricName": "successes_on_first_attempt",
              "value": 231203
            },
            {
              "metricName": "successes_after_retry",
              "value": 28013
            }
          ]
        },
        {
          "metricName": "time_to_first_attempt",
          "total": 0,
          "breakdown": [
            {
              "metricName": "time_to_first_attempt_average",
              "value": 30.628389015
            },
            {
              "metricName": "time_to_first_attempt_p95",
              "value": 30.628389015
            }
          ]
        }
      ]
    }
  }
}
Notable Definitions
While most definitions are provided within the Segment Event Deliver user interface and documentation, here are some notable definitions of metricName types that are returned-
Success_on_first_attempt: Count of successful deliveries to destination.
Success_after_retry: Count of successful deliveries to destination after a retry. Learn more about retires here: https://segment.com/docs/connections/destinations/#retries
Discarded: events that are considered failed after retry, with associated error message.
Time_to_success_p95: This is the time it takes for Segment to deliver the slowest 5% of your data (known as P95 latency).
Step 6: Submit your GET Request for Event Volume
Parameters for the Event Volume API are similar to Delivery metrics:
curl --location 'https://api.segmentapis.build/events/volume?granularity=HOUR&startTime=2023-07-31T00%3A00%3A00Z&endTime=2023-08-02T00%3A00%3A00Z' \
--header 'Authorization: Bearer #REDACTED#'
{
"data": {
"path": "/observability/event_volume/v2.json",
"query": {
"workspaceId": "opzvxHK692ZJJicNxz1AfL",
"startTime": "2023-07-31T00:00:00Z",
"endTime": "2023-08-02T00:00:00Z",
"granularity": "HOUR"
},
"result": [
{
"total": 18658554,
"series": [
{
"time": "2023-07-31T00:00:00Z",
"count": 389258
},
{
"time": "2023-07-31T01:00:00Z",
"count": 386948
},
{
"time": "2023-08-01T23:00:00Z",
"count": 388497
}
]
}
],
"pagination": {
"current": "MA==",
"totalEntries": 1
}
}
}
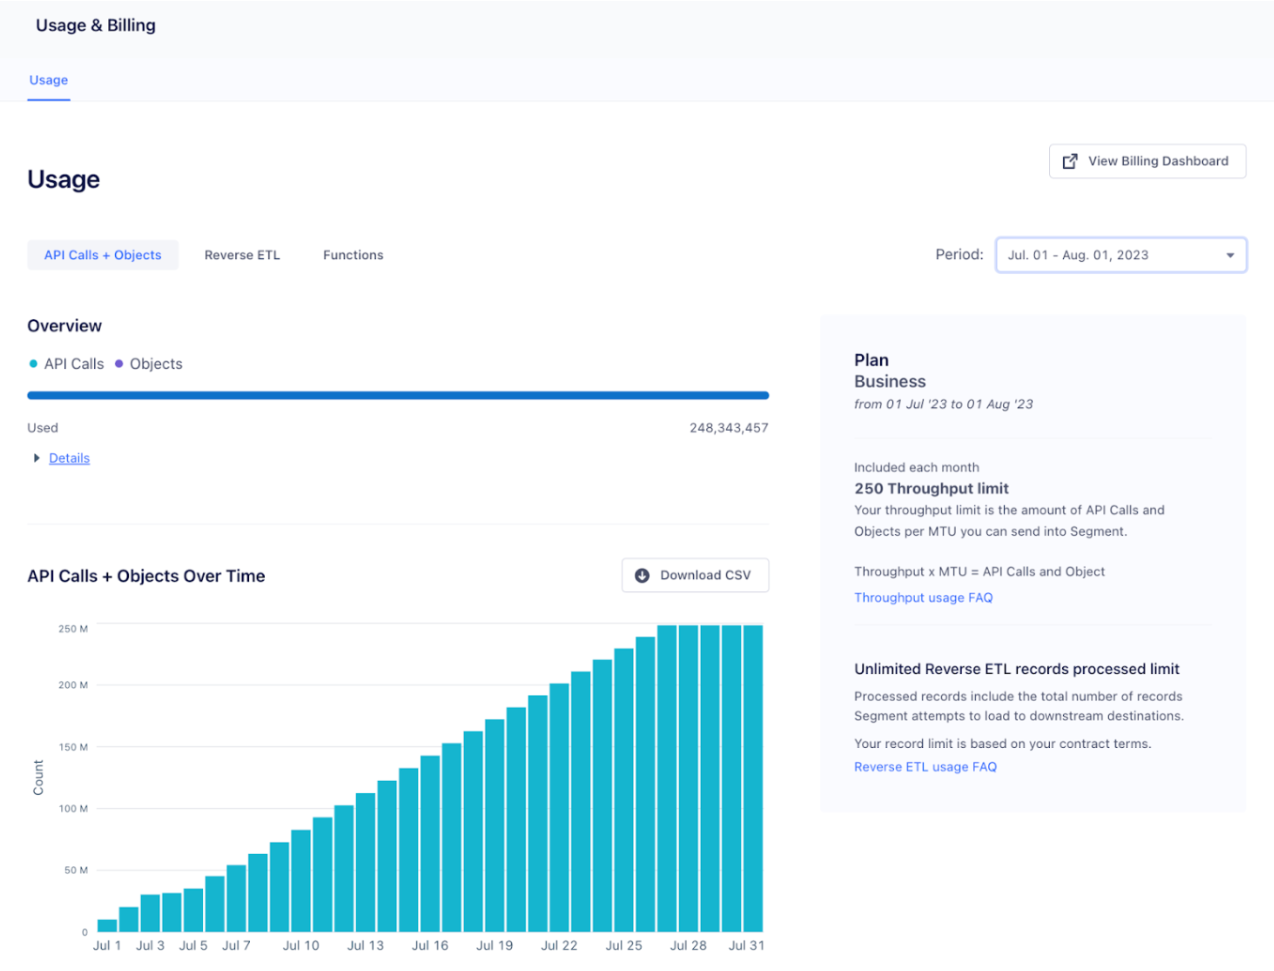
Advanced Tip: Usage API
Usage API tracks metrics specific to your billable usage, notably your Monthly Tracked Usage and your APIs (which is the same metric as Events being tracked by Source):
https://docs.segmentapis.com/tag/Monthly-Tracked-Users#operation/getDailyPerSourceMTUUsage
This API is useful to complement the Usage and Billing page. By adding this data to observability or a data warehouse, you can set up custom alerts or reporting to reduce surprise overages.
This is especially useful if you have billable metrics allocated across multiple workspaces.
Currently, the usage API aggregates MTU and API metrics on a daily basis by default.
Example Request
curl --location --globoff 'https://api.segmentapis.build/usage/mtu/sources/daily?period=2023-07-01&pagination[count]=200' \
--header 'Authorization: Bearer #REDACTED#'
Example Response
TIP: We also provide the number of anonymous and identified users on a daily basis by Source in this example. This could be useful beyond billing purposes, to help you understand your anonymous to identified conversations by specific source, over time.
{
  "data": {
    "dailyPerSourceMTUUsage": [
      {
        "sourceId": "9eMzcYkXfNigKZyD3u3kVR",
        "periodStart": 1688169600,
        "periodEnd": 1690848000,
        "anonymous": "0",
        "anonymousIdentified": "0",
        "identified": "288",
        "neverIdentified": "0",
        "timestamp": "2023-07-01T00:00:00.000Z"
      },
      {
        "sourceId": "fAR5u7MrUga99yGBBQWWmu",
        "periodStart": 1688169600,
        "periodEnd": 1690848000,
        "anonymous": "0",
        "anonymousIdentified": "0",
        "identified": "1",
        "neverIdentified": "0",
        "timestamp": "2023-07-01T00:00:00.000Z"
      }
    ]
  }
}
Advanced Tip: Mapping to an Observability Tool
Observability solutions commonly accept generic time series data to include in monitoring. As one example, we could map our Event Delivery metric response to:
DataDog’s time series Metrics API- https://docs.datadoghq.com/api/latest/metrics/#submit-metrics
Or New Relic’s Metrics API: https://docs.newrelic.com/docs/data-apis/ingest-apis/metric-api/report-metrics-metric-api/
If you’re storing the data in a data warehouse, you can simply map the data to your existing schema for monitoring, or define a new schema.
Notable Mappings
Each metric name returned from Public API is commonly mapped to a metric record, and subsequently a dashboard where you can view time series data and set alerts for. There are typically a few key concepts for metrics:
Count: Total count of the metric.
Start and end time: Mapped to the start and end time from the request made to Segment Public API.
Distribution type: Mapped to the way the metric is distributing the count. In this case, Segment counts the grand total of successes and failures, and distributes time to success as a P95.
For example, each of the following could be a distinct metric:
Successes: general tracking of successful delivery for a destination, as a distribution type, count.
Discarded: number of total failures, as a distribution type, count.
Time to success p95: can typically be mapped to a metric defined as a distribution type, percentile.
Wrapping up
Here’s what we’ve done in this growth recipe:
Understand how Public API’s Event Delivery and Event Volume endpoints work
Set up a token and test the API
Choose a Destination and associated Source to generate metrics for
Specify how you want to summarize the metrics
Understand Public API’s JSON response and use it with an Observability tool
Getting started is easy
Start connecting your data with Segment.