Testing and Debugging
One of the most important questions you’ll ask early on is “How do I know if Segment is working?”
There are several ways to check if your data is flowing. One is the Debugger tab in each Source in the Segment web app, where you can see data coming from a source into Segment. Another is the Event Delivery tool which shows which data is arriving at specific destinations.
For monitoring purposes, you’ll also see alerts in the Workspace Health tool if your sources or destinations produce repeated errors.
The Source Debugger
The Source Debugger is a real-time tool that helps you confirm that API calls made from your website, mobile app, or servers arrive to your Segment Source, so you can troubleshoot your Segment set up even quicker. With the Debugger, you can check that you’re sending calls in the expected format, without having to wait for any data processing.
The Debugger is separate from your workspace’s data pipeline and is not an exhaustive view of all the events ever sent to your Segment workspace. The Debugger only shows a sample of the events that the Source receives in real time, with a cap of 500 events. The Debugger is a great way to test specific parts of your implementation to validate that events are being fired successfully and arriving to your Source.
To see a more complete view of all your events, we recommend that you set up either a warehouse or an S3 destination.
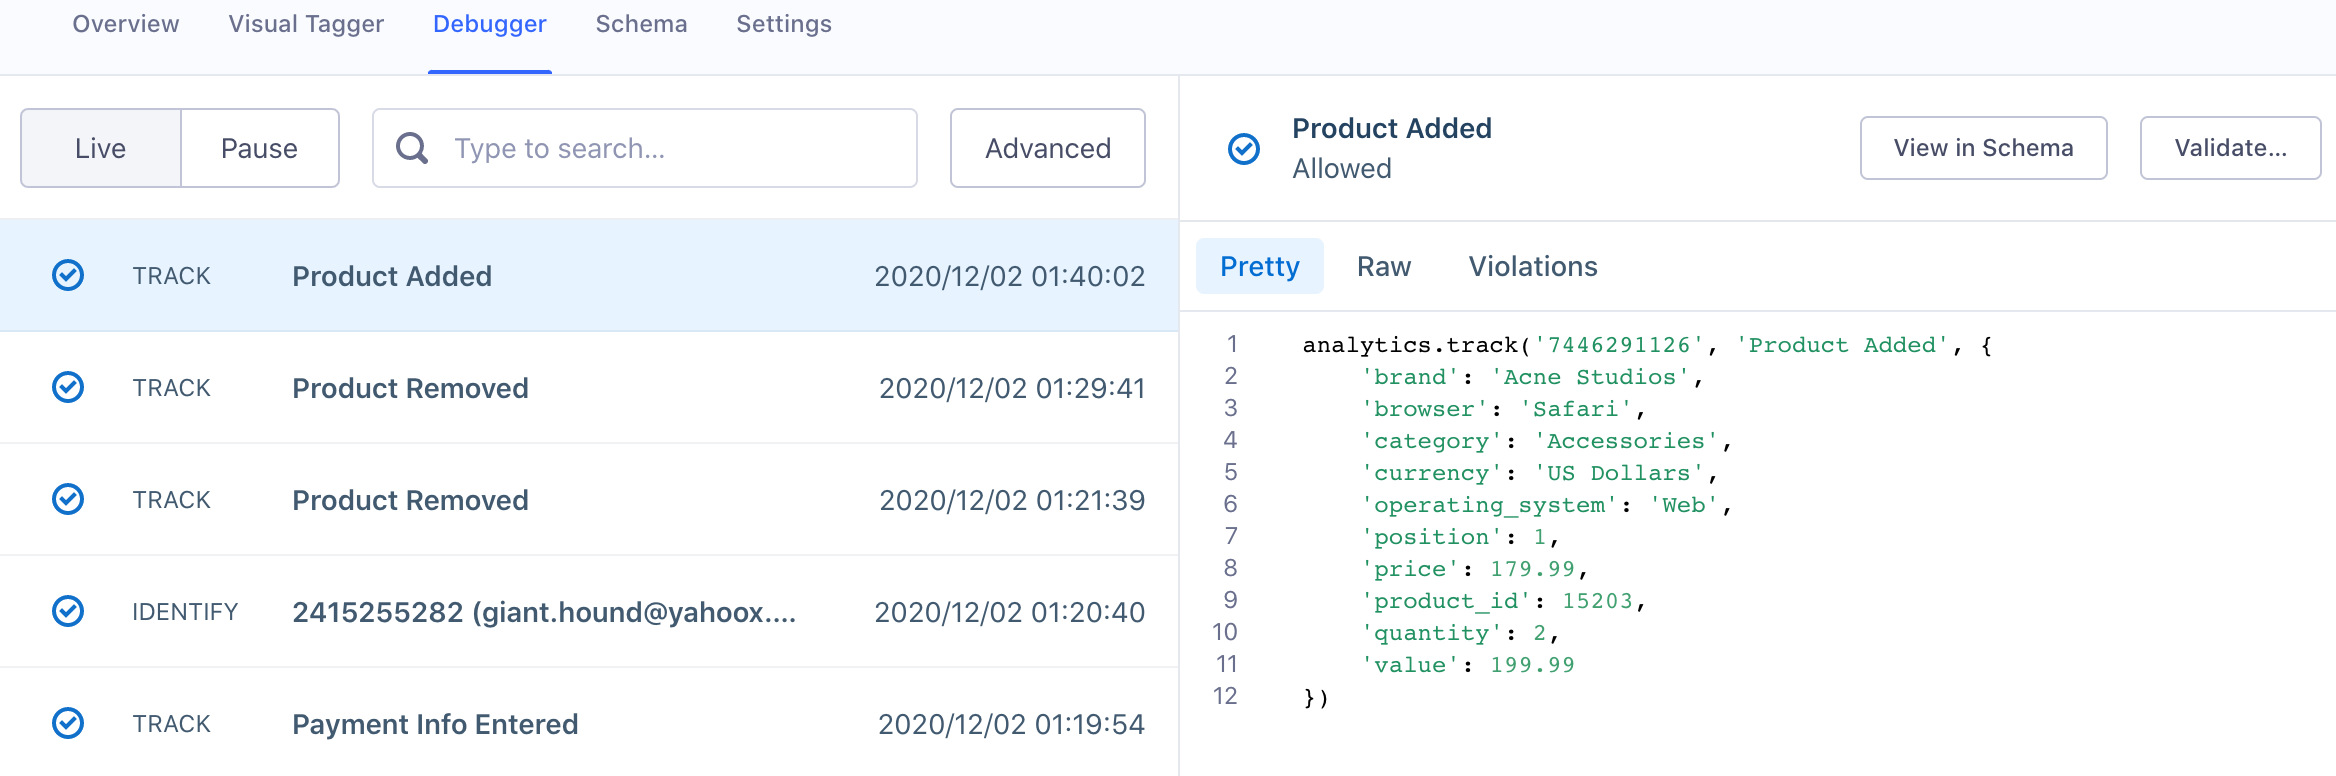
The Debugger shows a live stream of sampled events arriving into the Source, but you can also pause the stream from displaying new events by toggling “Live” to “Pause”. Events continue to arrive to your Source while you Pause the stream.
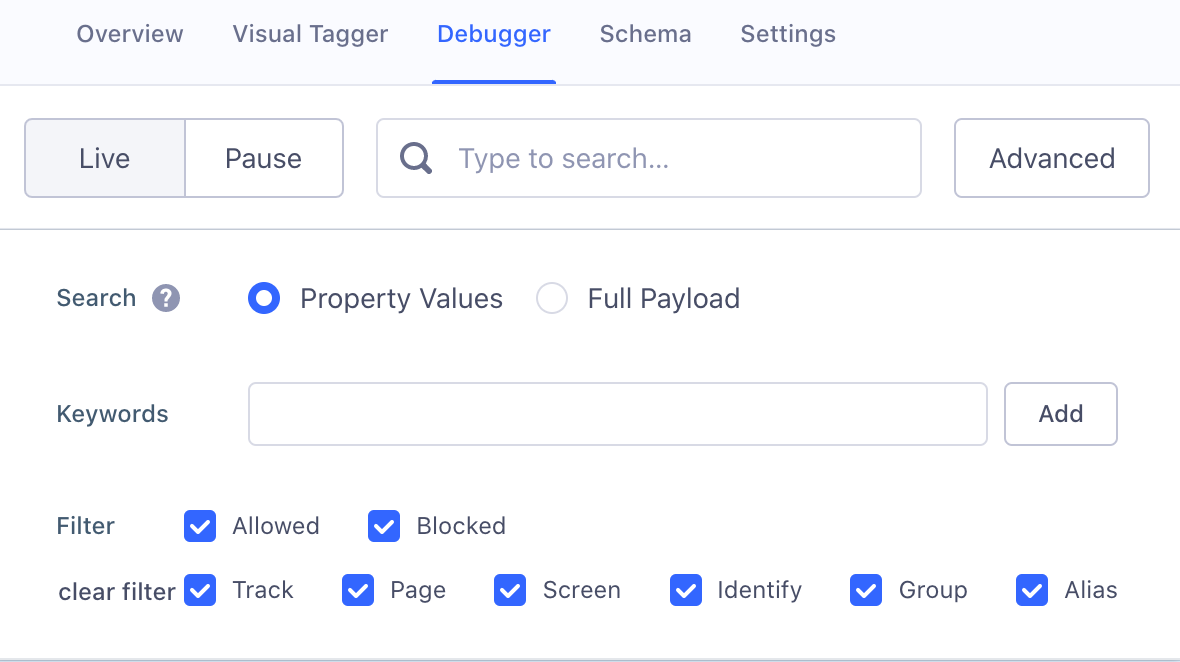
You can search in the Debugger to find a specific payload using any information you know is available in the event’s raw payload. You can also use advanced search options to limit the results to a specific event.
Two views are available when viewing a payload:
- The Pretty view is a recreation of the API call you made that was sent to Segment.
- The Raw view is the complete JSON object Segment received from the calls you sent. These calls include all the details about what is being tracked: timestamps, properties, traits, ids, and contextual information Segment automatically collects the moment the data is sent.
Event Delivery
The Event Delivery tool helps you see if Segment is encountering issues delivering your data from your sources to their connected destinations.
Segment sends billions of events to destinations every week. If our systems encounter errors when trying to deliver your data, we report them in the Event Delivery tool.
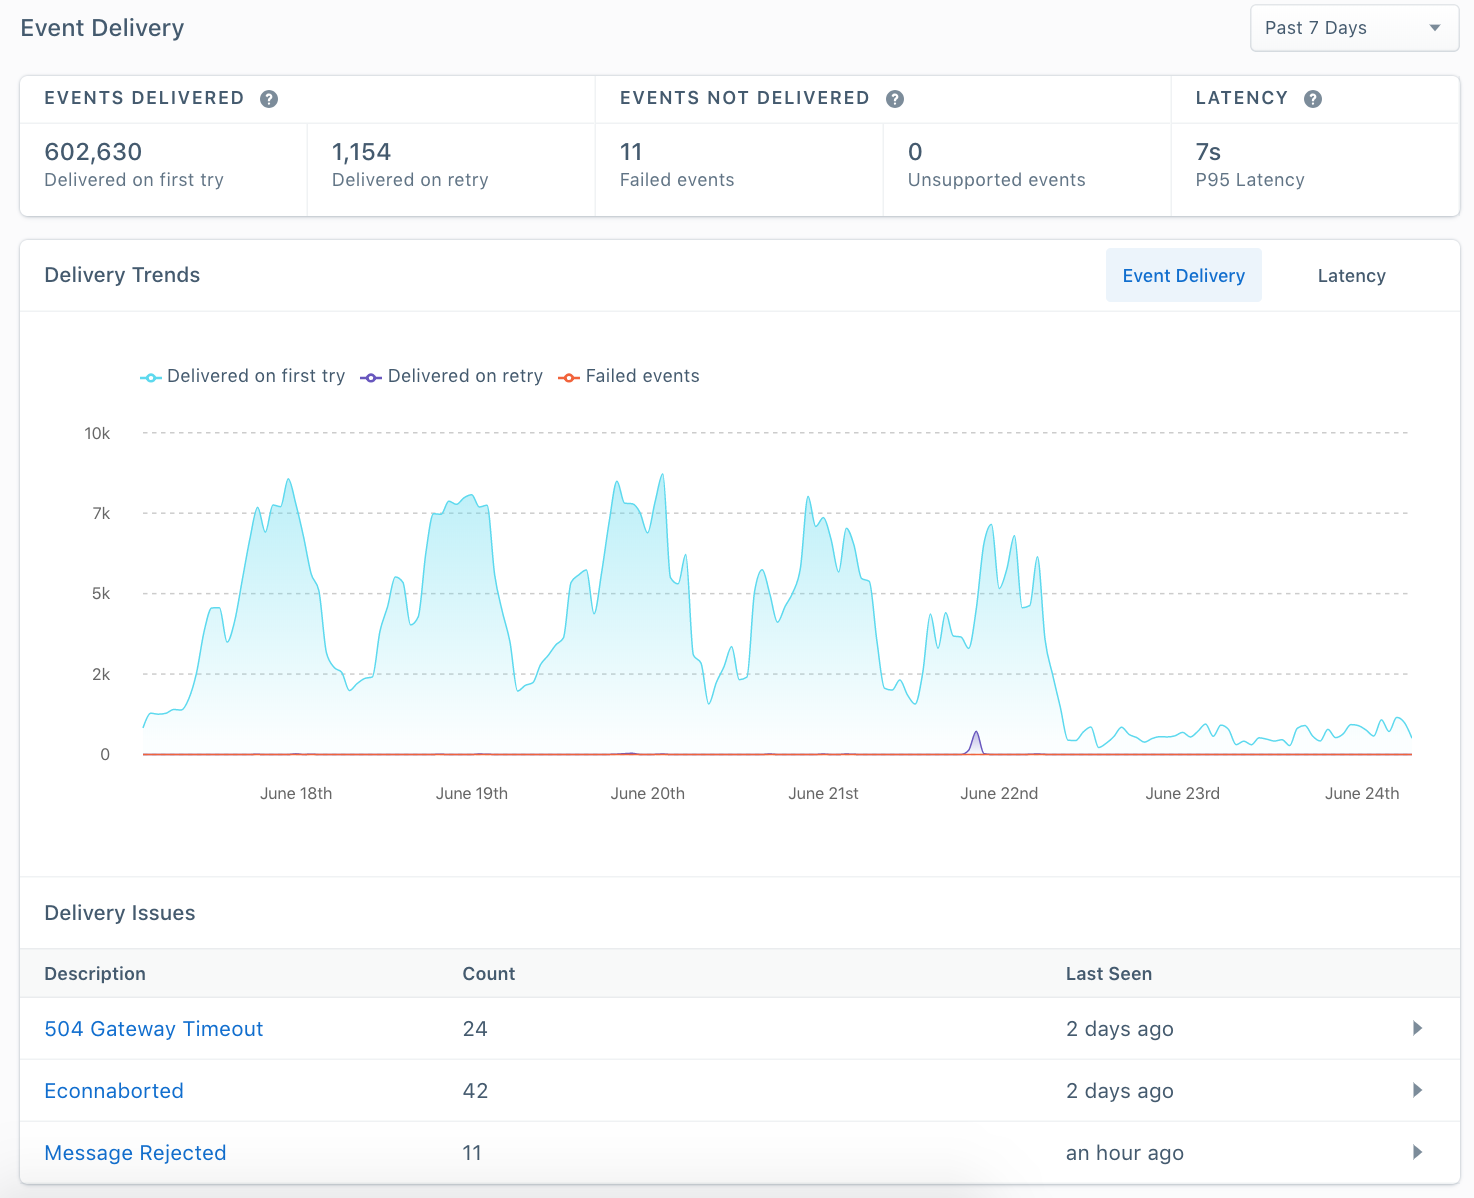
Here is an example of what the Event Delivery tool looks like:
Event Delivery is most useful when:
- When data seems to be missing in your destination. For example, you have Google Analytics set up as a destination and your recent data looks incomplete
- When setting up a destination for the first time. For example, you are connecting Google Analytics to your Node Source. Once you’ve entered your credentials and turned the destination on, you can use this feature to see whether events are successfully making it to GA in near realtime.
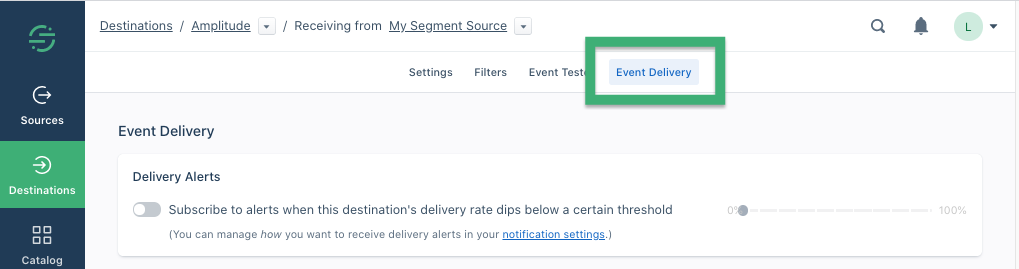
You can access the Event Delivery tool from the destination Settings tab in any supported destination.
Event Delivery is only available for cloud-mode destinations, which receive data through the Segment servers. Device-mode destinations receive data through an API endpoint outside the Segment servers, where we cannot monitor or report on it. Event delivery is not available for Warehouses or Amazon S3 destinations.
Using Event Delivery
The UI shows three parts that report on Segment’s ability to deliver your source data: Key Metrics, Error Details, and Delivery Trends.
Before you begin, select a time period from the drop down menu at the right. The Event Delivery display updates to show only information about your selected time period.
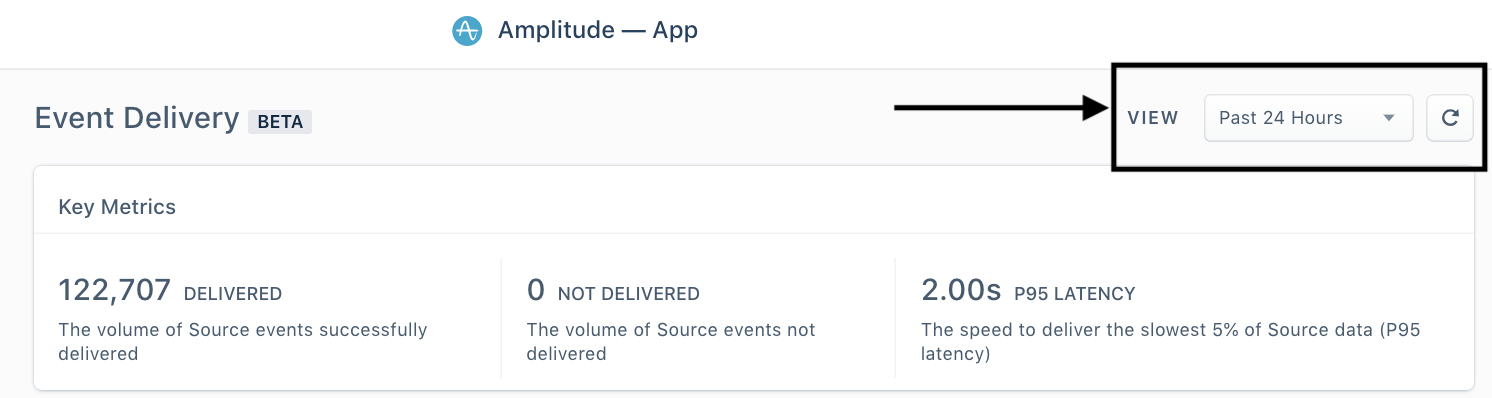
Key metrics
This panel displays quantitative information about the destination’s data flow:
-
Delivered: The number of messages Segment successfully delivered to the destination in the selected time period.
-
Not Delivered: The number of messages Segment was unable to deliver. If this number is greater than zero, the reasons for these failures appear in the errors table below.
-
P95 Latency: The time it takes for Segment to deliver the slowest 5% of your data (known as P95 latency). The latency reported is end-to-end: from the event being received through the Segment API, to the event being delivered to partner API. This helps tell you if there is a delay in your data pipeline, and how severe it is.
Error details
The Error details table displays a summary of the errors in a given period, and the most important information about them. You can click any row in the table to expand it to show more information.
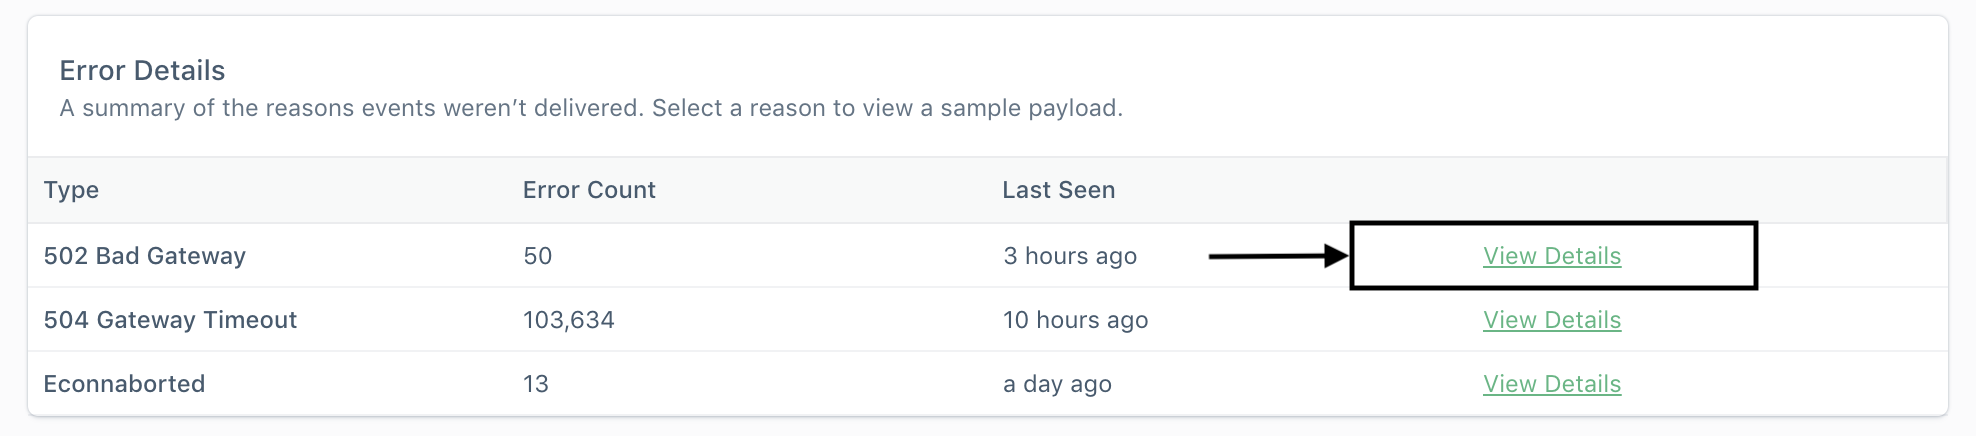
The Error Details view gives you as much information as possible to help you resolve the issue. The example below shows an example Error Details panel.
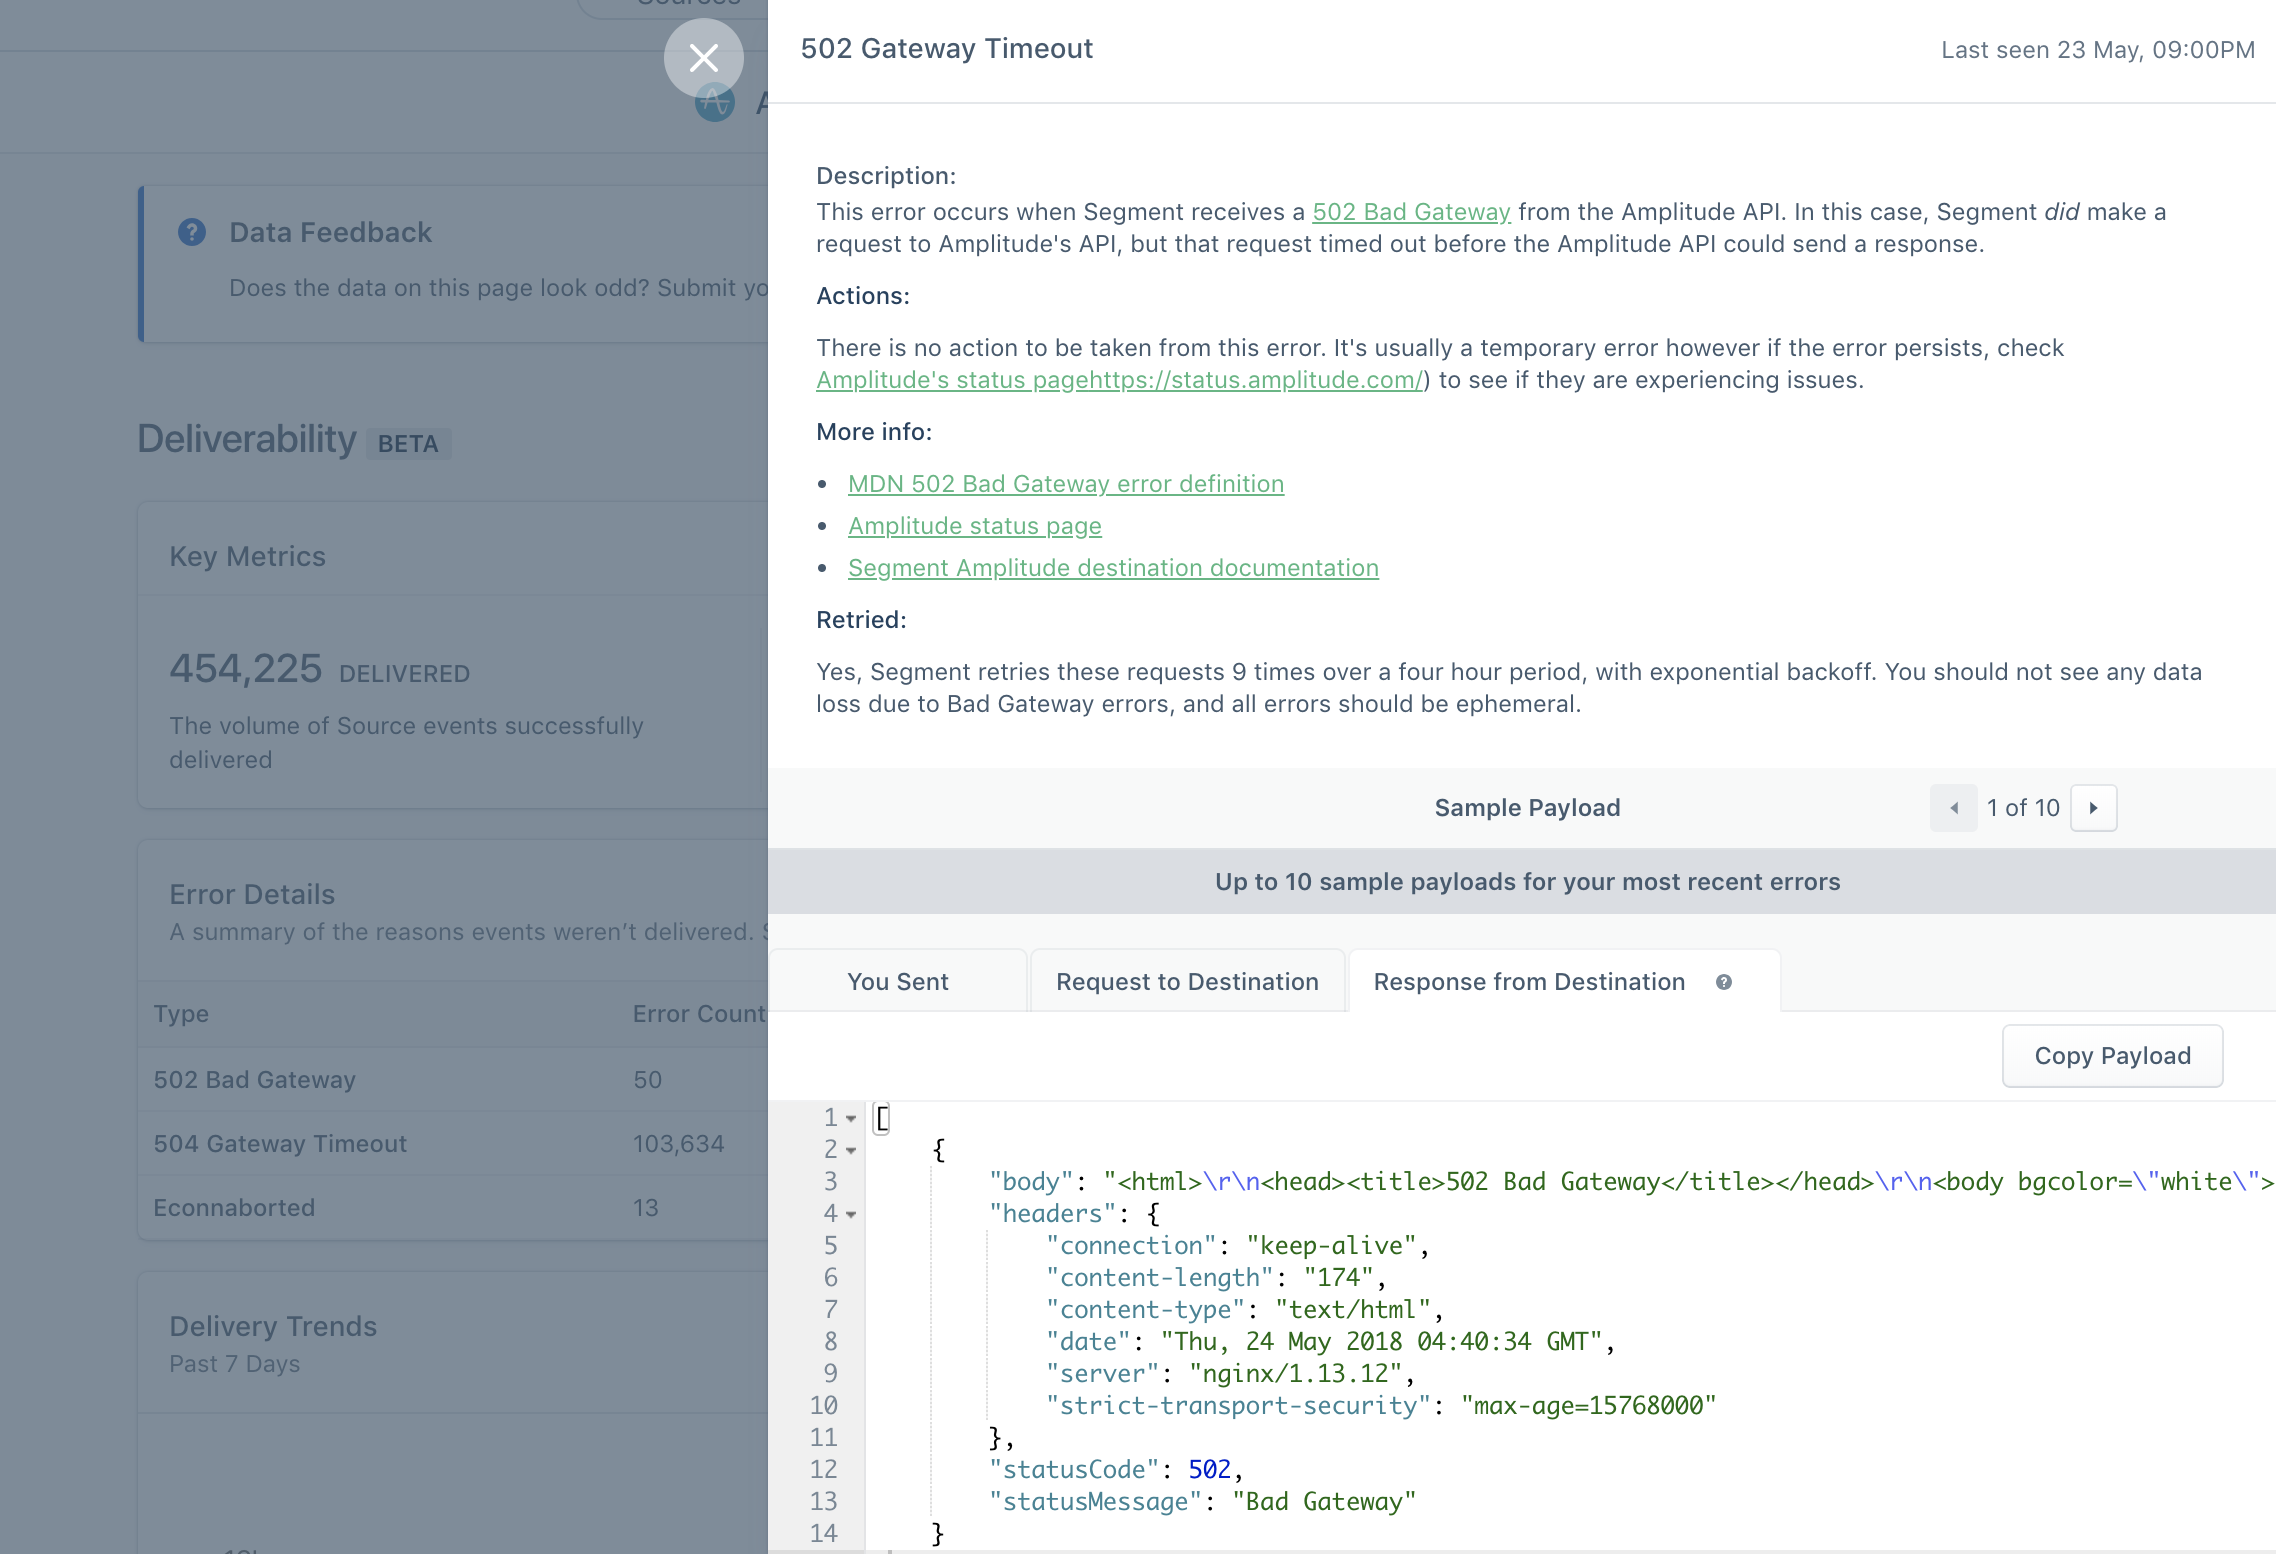
This view includes:
- Description The event delivery UI provides a human-friendly summary of the error, based on the payload Segment received back from the partner.
- Actions These are actions you can take, based on what Segment knows about the issue.
- More Info Links to any documentation that might be helpful to you.
- Sample payloads
To help you debug, Segment provides sample payloads from every step of the data’s journey:
-
You Sent - the data you sent to Segment’s API.
-
Request to Destination - the request Segment made to the Partner API. This payload will likely be different from what you sent it because Segment is mapping your event to the partner’s spec to ensure the message is successfully delivered.
-
Response from Destination - the response Segment received from the Partner API. This will have the raw partner error. If you need to troubleshoot an issue with a Partner’s Success team, this is usually something they’ll want to see.
-
View Segment’s list of Integration Error Codes for more information about what might cause an error.
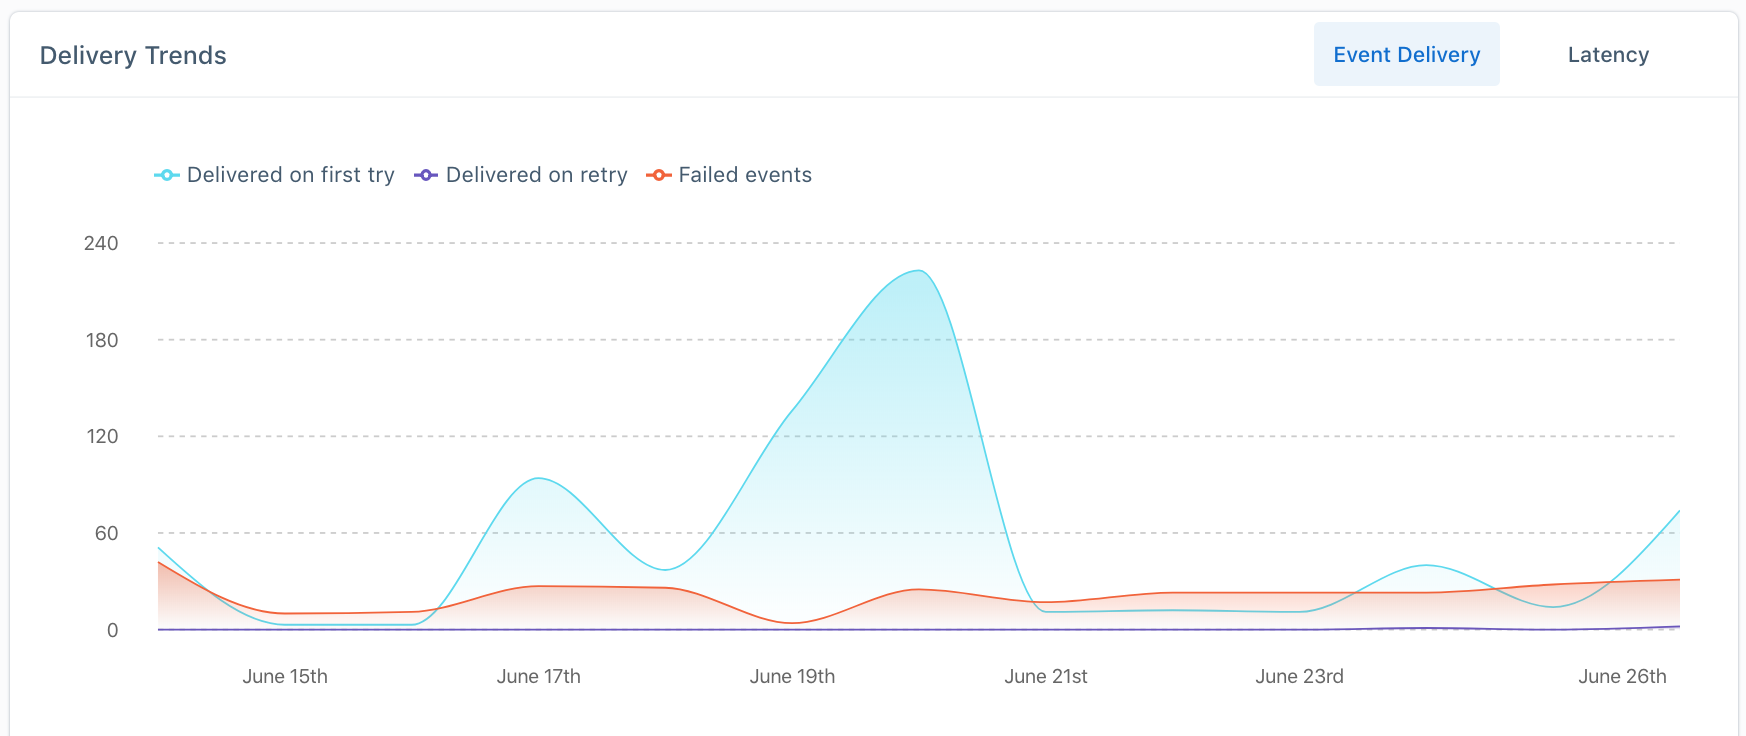
Trends
When debugging, it’s helpful to see when issues start, stop and how they trend over time.
The Event Delivery view shows a graph with the following information:
-
Delivered: The number of events that were successfully delivered in the time period you selected.
-
Not delivered: The number of events that were not successfully delivered in the time period you selected.
The Latency view shows the end-to-end P95 latency during the time period you selected.
This page was last modified: 06 Jul 2022
Need support?
Questions? Problems? Need more info? Contact Segment Support for assistance!