Workspace Home
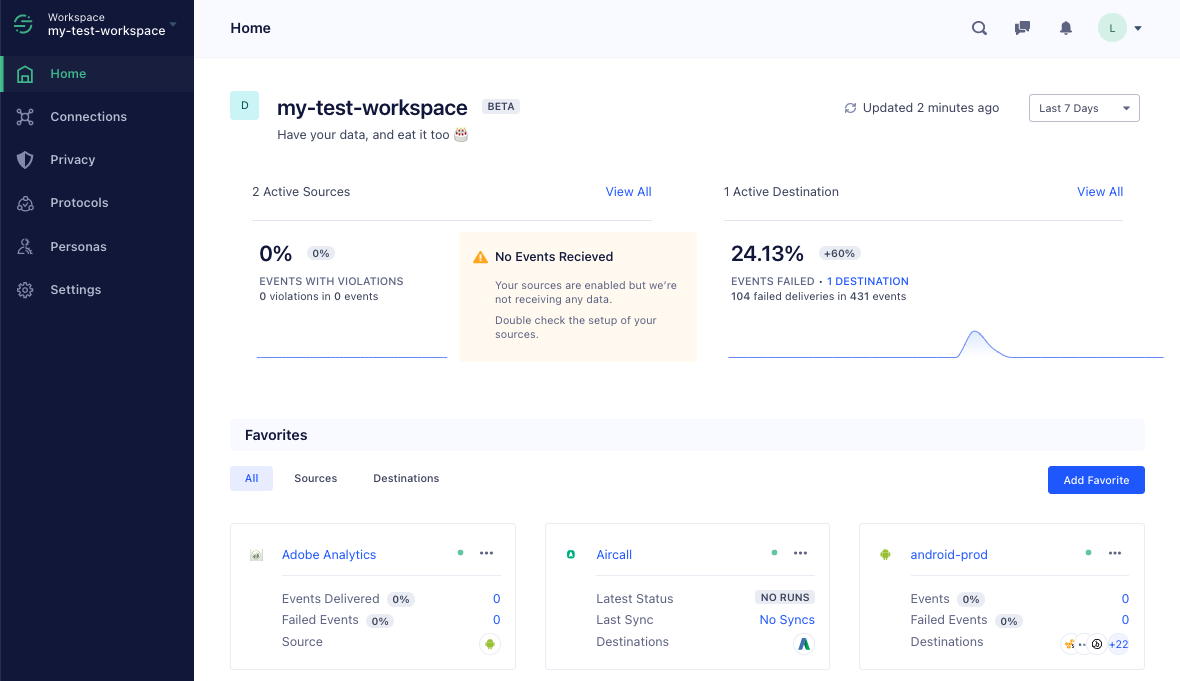
Segment’s Workspace Home serves as a dashboard that gives you a single consolidated view of the workspace, its health and status, and metrics for specific integrations over time.
Availability
The Workspace Home is visible to users who have the Workspace Owner role. If you have access to the Home page, it is the first screen you see when you log in to your Segment Workspace.
The Home page shows a summary of errors in the workspace’s sources and destinations, a list of “favorite” integrations that you can configure, and information about recent audit logged events, and your billing plan usage.
Workspace Home reporting period
The Workspace Home page shows when the data it represents was last updated. You can click the Updated line to refresh the display.
You can also use the drop-down menu at the right to choose between a 24-hour and 7-day rolling view of the data. The page automatically updates the graphs and statistics when you change your selection.
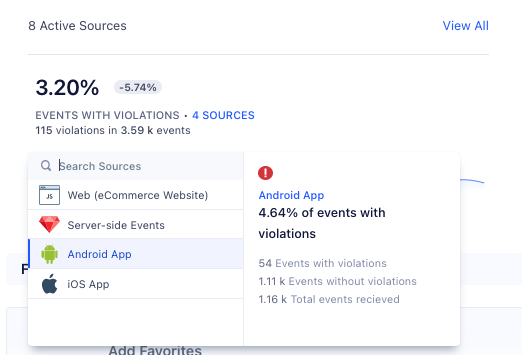
Sources - Violations
The Sources section of the Home pages shows a summary of the event volume flowing through Segment.
If your Segment plan includes Protocols, the dashboard shows Event Violations occurring in the workspace, including a graph over time. You can click into the violations section to see a list of sources ordered from highest number of violations, to lowest. You can click into individual sources to see more details and go to their individual source pages, or go to the Violations page.
Sources - Events Received
If your Segment plan does not include Protocols, an Events Received chart is shown to reflect the number of events received across sources.
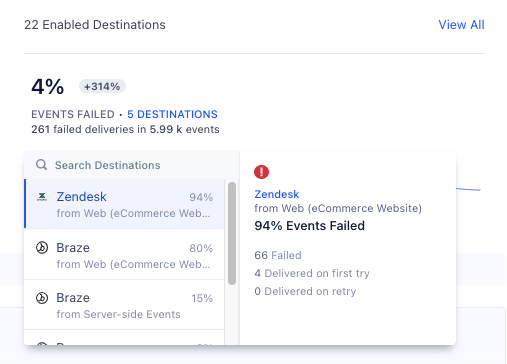
Destinations - Event Delivery
The Destinations section of the Home page shows a summary of the Event Delivery for the workspace, including a graph over time. You can click the destinations link to see a list of destinations with delivery problems, ordered from highest to lowest error rate. You can click a destination to see more details about the delivery failures, and from the details panel click the destination name to go directly to its configuration page.
Favorite integrations
If you have access to the Workspace Home page, you can customize it for yourself by bookmarking or saving “favorite” integrations. These could be sources, destinations, storage destinations, and functions that you work with regularly, or want to monitor closely.
These Home page favorites are specific to your user account in the workspace. The are not shared among administrators in the same workspace, and are not accessible from other workspaces you might be an administrator for.
To create a favorite, click Add Favorite or the plus icon, and select the integration(s) to bookmark. The list that appears displays a status icon for each integration, so you can tell which ones are healthy (green) and unhealthy (red), and which ones are inactive (gray).
Once you create a favorite, the section displays your favorites in tabs so you can view sources only, destinations only (including storage destinations), or all of them at once. Each favorite displays important configuration details and summary statistics for that integration. You can click the more (…) menu to jump directly to one of the configuration or detail pages for that integration.
To delete a favorite, click the more (…) menu and select Remove favorite.
Recent Activity
For users with Business Tier workspaces, the recent activity section displays the most recent items logged to the Segment Audit trail. This includes workspace membership changes and requests, changes to the configuration of different Segment features (including sources, destinations, and to Engage and Protocols configurations), and data storage sync failures.
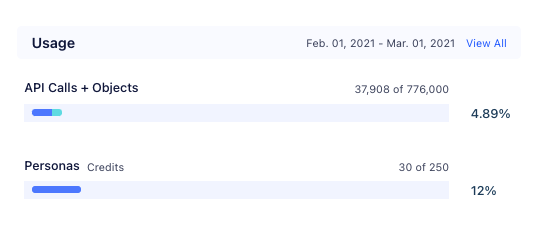
Usage
The Usage section shows a summary of the workspace’s plan utilization for the current billing period. This includes billing information for all parts of your Segment plan. This includes MTUs or API call volume (as applicable), Functions usage time (if applicable), and Engage details (if applicable). Click view all to go to the workspace’s billing page for more detailed statistics.
This page was last modified: 21 Apr 2023
Need support?
Questions? Problems? Need more info? Contact Segment Support for assistance!