Do you have a single source of truth for your data? As our customer Ole Dallerup, VP of Engineering from Trustpilot says, “your data is useless if it’s not in one place.” The problem with disparate data sources is that your insights stop with the walls around your data — in your CRM, in your funnel analytics tool, in your email platform. How does one part of the customer experience influence another? What’s the root cause of a behavior? These are the kinds of questions Trustpilot is answering with Segment Sources.
Trustpilot provides an online community featuring reviews on more than 100,000 companies. Their reviews and ratings help consumers make smarter, more informed purchasing decisions. On the other side of their content marketplace, Trustpilot works with business listers to help build their audience and drive traffic to their sites.
Ole believes that, while reporting in tools like SendGrid and Salesforce are pretty good, the real issue is that you can’t join that data with your product behavioral data to gather deeper insights on your customers.
In this Q&A, Ole shares why bringing all of his data sources into a single warehouse is key to investigating anomalies in user behavior, building a better product, and providing exceptional customer service.
Ole discusses:
-
Why Salesforce, Zendesk, and SendGrid reporting tools are good, but unfortunately isolated
-
How tying CRM and email data with product data is the only way to conduct useful, investigative analysis
-
Top use cases for having his product, sales, support, and email data all in one place
-
Trustpilot’s philosophy on building vs. buying software services
Dive in below, or get the PDF.

Diana: Hey, Ole! Thanks for chatting with us today. We’d love to hear more about Trustpilot to set the stage here.
Ole: Thanks, Diana. Trustpilot is a review site for businesses. We believe that transparency through reviews helps both end customers and businesses have better experiences. We help customers make informed purchase decisions and empower businesses to use reviews to drive more sales.
Diana: As VP of Engineering, what are you focused on? What projects are you working on right now?
Ole: In short, I oversee all of our systems and infrastructure, and I lead the developers, testers, and data science teams globally. It’s important to me to build a strong culture that empowers the individual engineers as well as the teams to deliver and discover the best solutions using the latest technology. I set our engineering strategy, from APIs first, to continuous development, and microservices
I also work closely with the business and product leadership teams to empower them with the data, tooling, and analytics they need to keep delivering awesome experiences.
Right now, I’m really excited about a project to pull together our data across every customer touchpoint using Segment Sources. We actually have a lot of customer data siloed in different tools like Salesforce, SendGrid, and Zendesk. We want to put it together in one place, so we have the data to answer any question we might have about our customers.
Diana: That’s awesome. Let’s talk a little bit about each source of data and what kind of analysis you’re running. How about Salesforce? What are you working on there?
Ole: Our team keeps all of the conversations and deals with business listers in Salesforce. We were doing a lot of our reporting in Salesforce, but honestly it’s just not that good. We had a bunch of operations and engineering folks working on cleaning up their dashboards into something really useful for the executive team.
However, when we found out we could just push the CRM data into our Redshift database, it made our lives a whole lot easier. Now, it only takes us a quick refresh of a query to answer a question compared to hours of poking around and finagling the data or asking sales ops to run a time consuming custom report.
After turning on the Salesforce Source, the first thing we did was rebuild all of our reports and some new ones with Chartio on top of Redshift. This combo gives us more portability and opportunity to drill into spikes and valleys in the data than Salesforce would on its own.
However, the more visionary analysis we’re working on now is identifying the what types of customers lead to the highest average contract value. We’re also investigating how different segments of customers behave all the way down the funnel and how long it takes for us to close deals across these segments. We’re querying Salesforce data alongside our product data we collect with Segment’s libraries to do that.
Diana: That’s awesome. But, why wouldn’t you just do all of this in Salesforce?
Ole: Well, you can’t really do most of this in Salesforce. You can get okay reporting in there itself if you’ve been working with the interface for years. But since I’m not in Salesforce all the time, I’d much rather just do a two minute query to find the contract value of customer in a specific segment or customers using our product in a specific way. Before, I had to hunt down Sales Ops folks and ask for a few hours of their time.
The real problem is not with Salesforce reports; it’s that I can’t merge my Salesforce data with the product data I’m collecting through Segment. And that’s where those fun analyses like close rates, etc for particular customer segments come in.
What’s more exciting is an analysis we’re working on uncovering which behaviors in the product lead to bigger deals. Once we have this data, we’ll tweak our design to encourage those behaviors.
You also mentioned SendGrid and Zendesk data sources. What are you doing with that data?
Primarily we’re using the Zendesk data for internal KPIs. For example, we’re measuring how much time we actually spend on solving tickets, and the total volume of the tickets we solve.
We also compare these numbers to see how support tickets are increasing in comparison to the number of reviews and business listings. For one, it helps us project how many support folks we need to hire. As you could imagine, we don’t want to infinitely increase our support team in direct correlation with growth, so we’re also looking for ways to minimize the Review to Ticket ratio and become more efficient.
The other cool thing about having all of this data in SQL is for ad hoc analyses. If people on the support team have a hypothesis, it’s super easy for them to run a query and see if they were right.
What’s an example of one of those ideas?
Let’s say they have a feeling that a certain question is coming up over and over again, and fixing the underlying problem would reduce ticket volumes. They can run a quick query to get a sense for the number of tickets on that topic against the overall ticket volume.
If there are only actually ten tickets, they probably won’t do anything. But if there are 100 tickets, they might figure out a way to automate a response, write a help article, or push through a product change.
Neat! And, are you tying together the Zendesk data with Salesforce?
We’re building a customer success dashboard in Chartio with product, Salesforce, and Zendesk data to give our account managers a view on the entire account. We want to see the stages of accounts, from the money, tickets, and product usage point of view.
So if I’m an account manager, and I know you’re using our products and have a good deal, but you also sent in a hundred tickets to our support team this week, we need to talk about that. It’s also just great context to check before sending an email to make sure nothing is on fire or find a great entry point into a relevant conversation.
Who’s looking at these kind of reports on the Zendesk data? Is it the head of customer support? Individual support reps?
Right now, it’s the team manager who is working very closely with the engineering team and analytics team to figure out what information each rep needs.
Mostly the technical analysts have the SQL skills to build these original reports, but once they are built, individual support reps and the team manager can use drag and drop capabilities within Chartio to drill down and find more information, and to replicate the reports for each account.
That’s awesome. You also mentioned SendGrid. How are you using SendGrid internally?
We’re heavy users of SendGrid. One of our products allows businesses with listings to email some of their customers asking for review, and that’s all powered through SendGrid.
We send 10, 15 million of these emails every month, so more insights are welcome! The reporting in SendGrid not bad, but again, the problem is that I can’t join it with the rest of the data I have.
One of the big things we’re using Sources for is to identify the root cause of bounce behavior. In SendGrid, I get an overview of bounces, but I need to know if it was a particular customer, region, or even domain that was causing the bounces. This is also really important for catching fraud. For example, some businesses that send tons of spam email to get reviews. Obviously that hurts our brand and our IP status.
With the data in a more flexible format, I can join with in-app behavior to isolate peaks and valleys in our data and find the real issues.
What would it look like if you were to build this kind of pipeline in house?
We’re a big buy over build firm. Our approach is to generally look for new technologies that can solve our problems. If we have to, we’ll build out our own solutions, but we’d prefer not to unless it’s really core to our business. In Segment’s case we were definitely looking to buy a product to manage data infrastructure, especially because my team doesn’t want to work on these kinds of piping and tracking projects. It would probably take at least a few weeks for each source, plus an annoying amount of maintenance to set this up ourselves.
We’ve already really enjoyed using Segment to send our website and mobile data to integrations like Mixpanel and Google Analytics. We started with integrating just a couple of analytics tools through Segment, but now, since it’s so easy to turn tracking tools on and off, I often browse the Segment catalog for new things to try.
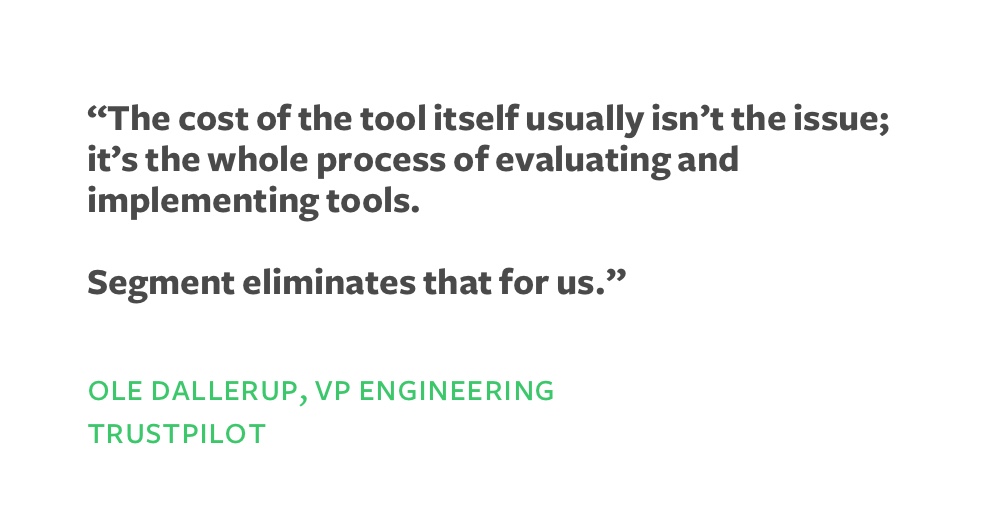
I look at all the tools you bring in and see if it’s something we could benefit from. It’s completely worth it for me to take a day of my time verify if a new tool is actually useful for our business. I flip it on and play around with the data. If it stinks, no worries. We didn’t waste a bunch of time getting it integrated. If it’s helpful, well, that was easy. We’ll just start using it. The cost of the tool itself usually isn’t the issue; it’s the whole process of evaluating and instrumenting tools. Segment eliminates that for us.
After we were using Segment Integrations, it made sense to use the same tracking code, with no additional work on our end, to start piping that data a SQL database for more advanced analysis. We just turned it on and got a lot more granular access to our data.
And, now that you’re offering Sources, you’re solving a new, but related problem for us to get third-party cloud apps into the same data warehouse. Why would we build out something when you already have it, and we know it works?
Thanks to Ole for taking the time to share how Trustpilot is using different types of data sources to improve their product and customer service.
If you’d like to check out Sources yourself, learn more here, or explore some out-of-the-box dashboards you can get by connecting your Sources data with BI partners like Chartio.

The State of Personalization 2023
Our annual look at how attitudes, preferences, and experiences with personalization have evolved over the past year.