Reducing Indoor Carbon Dioxide
Elevated carbon dioxide impairs decision making. And it doesn’t take a lot of carbon dioxide either! Normal atmospheric carbon dioxide has risen from 280 ppm to 415 ppm in the past century, but in poorly ventilated buildings and stuffy meeting rooms, concentrations can easily get into the thousands of ppm. Unfortunately, above 1000 ppm there’s a substantial and measurable reduction in decision making performance.
A company lives and dies on decisions made every day at all levels, and we couldn’t tolerate an office environment that might be making our decisions worse! So we decided to measure carbon dioxide levels rigorously and see if improvements were necessary. (In the past we’ve also experimented with ways to improve focus by reducing noise and reducing stress & exhaustion by trying to minimize commute time.)
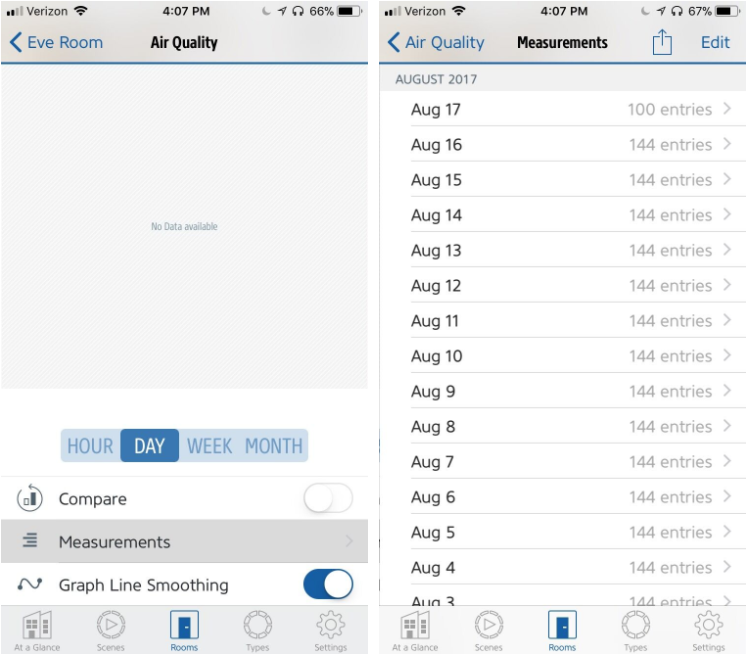
Luckily, measuring carbon dioxide levels turns out to be extremely cheap and easy to do. You can purchase an Eve Room online for $80 and drop the puck anywhere in your office. Here’s ours:

After letting it collect measurements for a couple days (or a month), you can export the raw data as a CSV:
We graphed the data and were surprised by what we saw.
First, there were some massive spikes to 2,500 ppm. And one several-day period of 1,000 ppm.
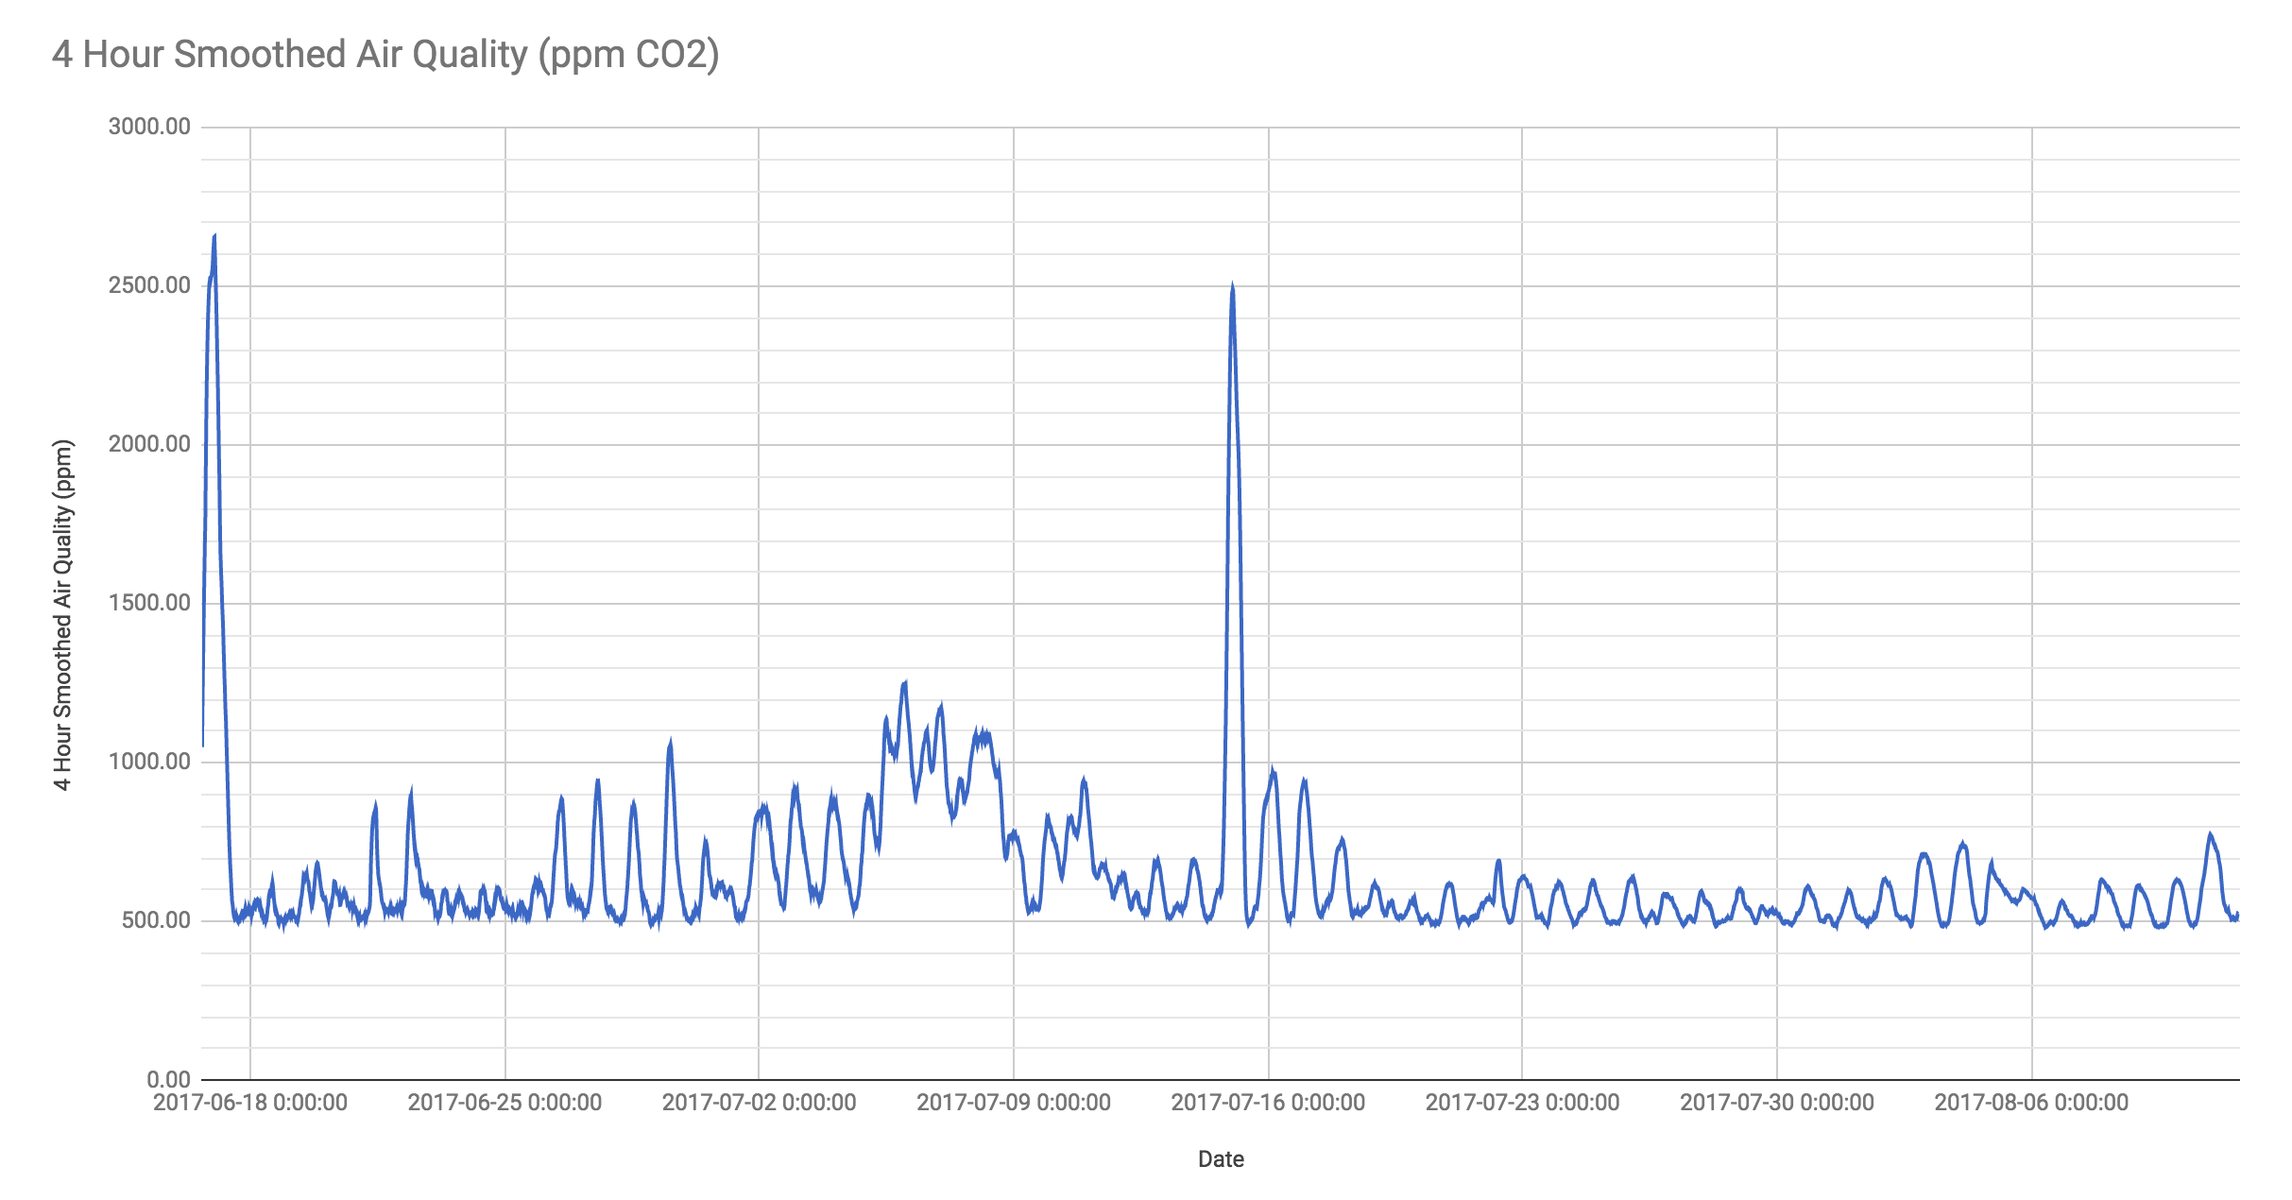
To understand what was going on, we contacted our building’s HVAC engineer and walked through the data with him. We learned that up until roughly July 23, the building had been completing the installation of new HVAC equipment and getting the hang of operating it. Also, the building had redone the roofing material, necessitating a partial shutdown of the HVAC system to prevent toxic roofing gases from entering the building. So that explains the first month of chaotic carbon dioxide levels. After that, it settles into a consistent daily rhythm well within reasonable carbon dioxide limits.
We also naively assumed that carbon dioxide would rise during the day when people were breathing, and fall at night after the HVAC system had cleared it out. We found the opposite.
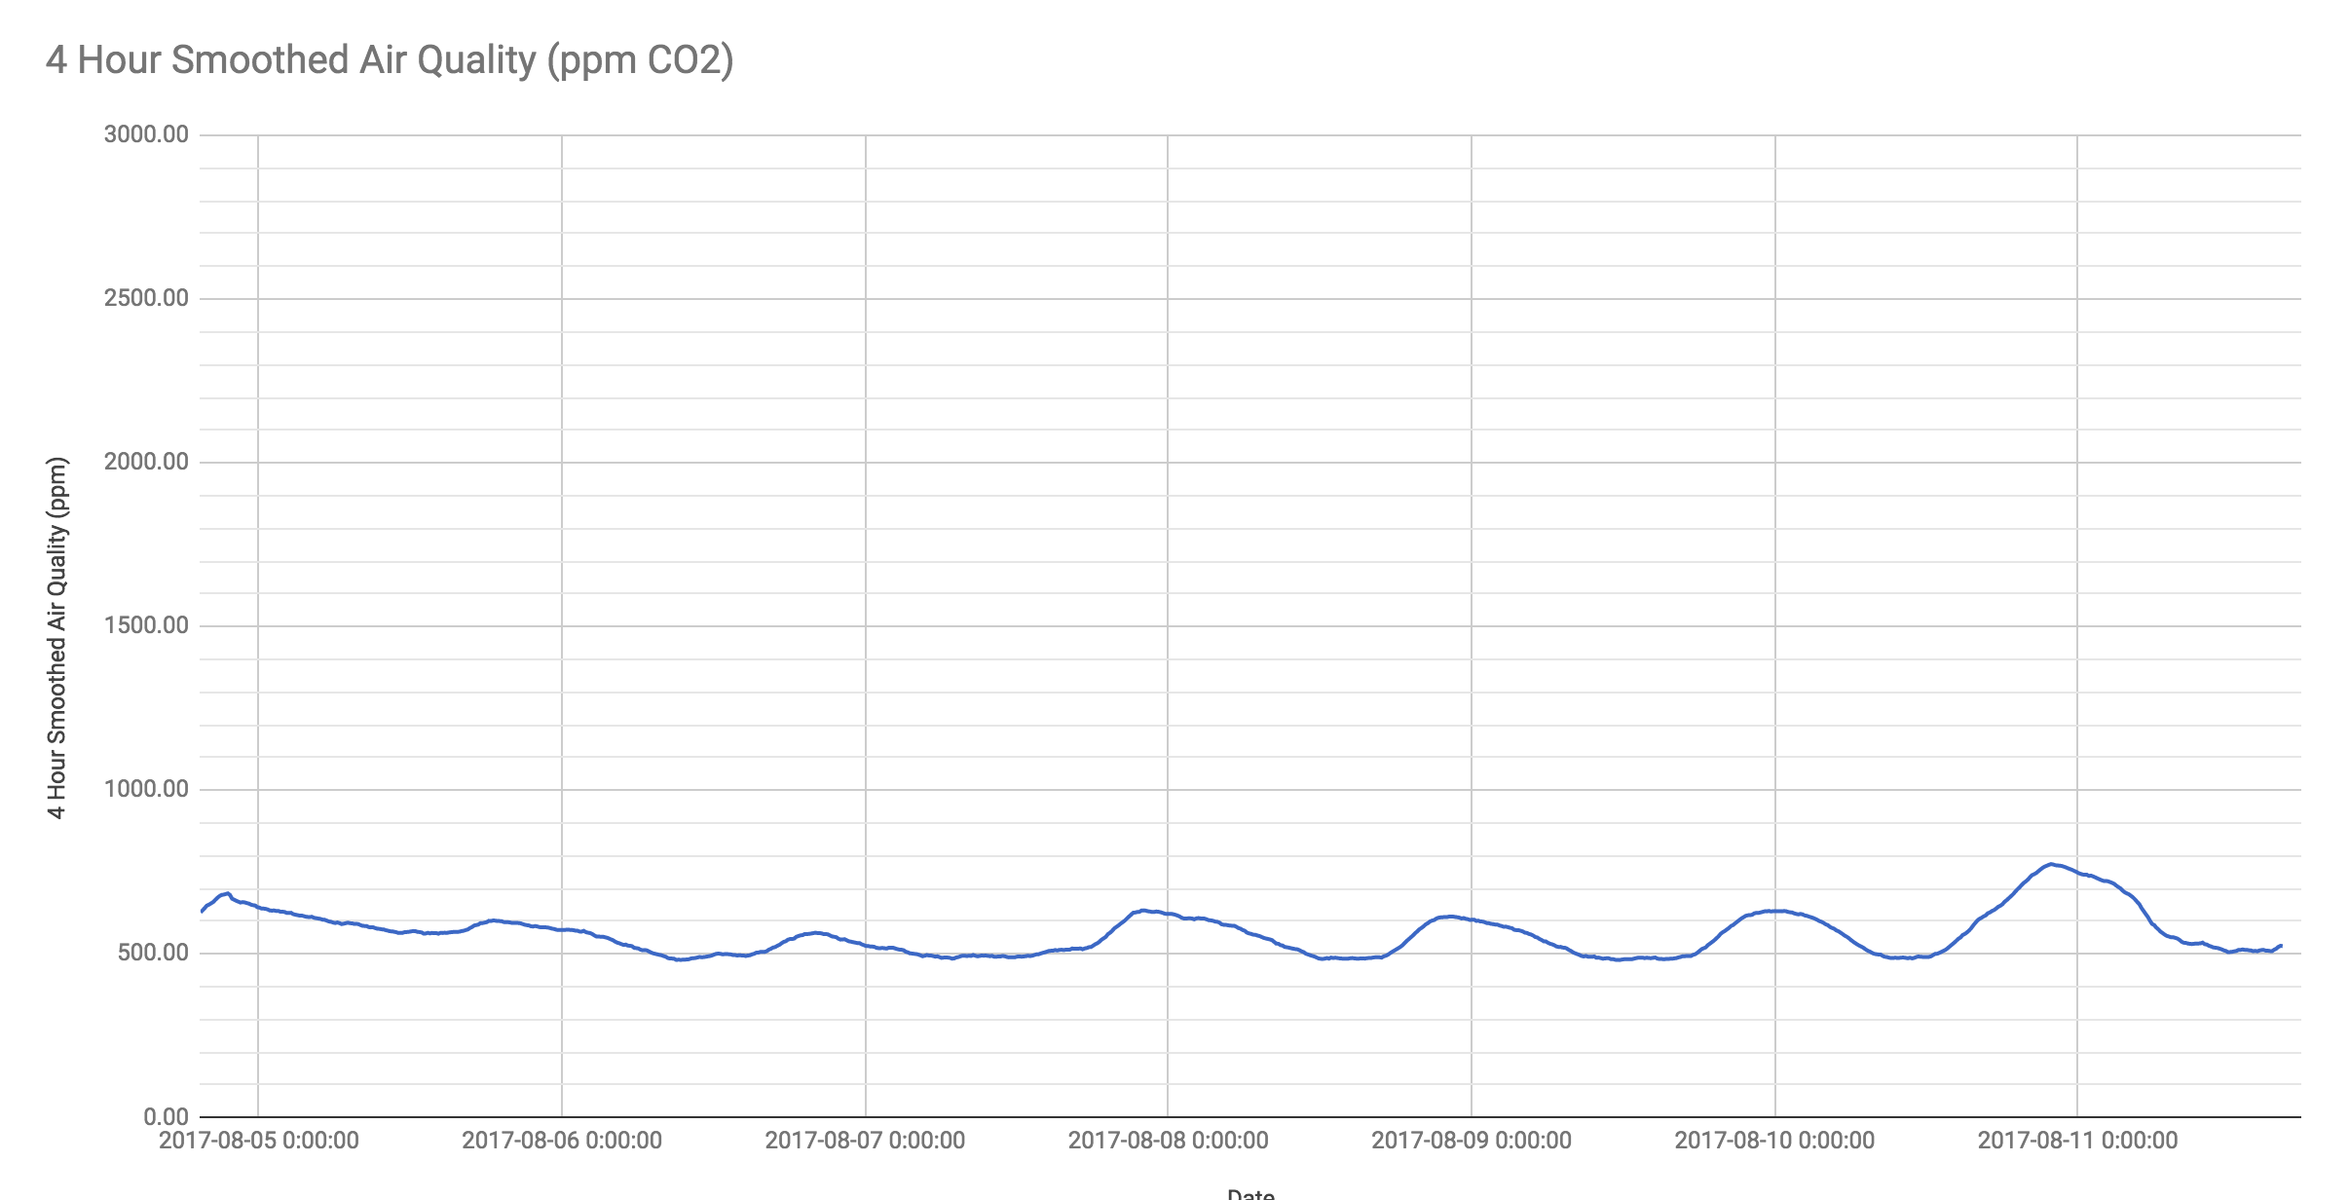
If you look closely at the above graph, you can see that carbon dioxide peaks around 11pm, and falls to its minimum during the day when people are around. After discussing with our HVAC engineer and running some rough calculations, we believe this cycle is driven by two factors:
First, the HVAC system shuts down late in the evening, and turns on early in the morning. So during the day, we’re mostly breathing fresh air from outside. Plus, the exuberant family of plants we have in our office is greedily consuming carbon dioxide too.
Second, when the HVAC system shuts down and people go home, night falls and the large number of plants in our office switch from photosynthesis to respiration. So at night we lose circulation of fresh air from outside, and the plants start producing carbon dioxide to stay alive. This drives up carbon dioxide levels.
After some initial concerns about the high carbon dioxide levels we were seeing in early July, we’re now happy with the levels we see day-to-day.
Given the substantial negative impact that carbon dioxide has on decision-making, I strongly recommend you spend the $80 on a carbon dioxide meter, run some analysis, and talk to your building’s HVAC engineer. And if you’re feeling adventurous, order some plants for a little extra boost.

PS. Our Head of Infrastructure suggested in jest that we use a geiger counter to check radiation levels. 😜 We’re happy—although slightly disappointed—to report that we were not able to find any radiation sources in the building.

The State of Personalization 2023
Our annual look at how attitudes, preferences, and experiences with personalization have evolved over the past year.