This post is a guest submission by our partners at Datadog, highlighting their new integration with Segment. Thanks to Datadog for building a Segment integration that gives you full visibility into your data pipelines—allowing you to build alerts and dashboards off of your Segment delivery data so you can quickly assess the health and performance of your pipelines.
Datadog is a monitoring platform that provides deep visibility into your applications and infrastructure, so you can seamlessly monitor metrics, distributed request traces, and logs across your stack. We are pleased to announce that our new integration with Segment enables you to track the health and performance of your event delivery pipelines for all of your cloud mode Destinations, and ensures that you're able to effectively troubleshoot anomalies in real-time.
A spike in event delivery latency, for example, could indicate a critical problem with your application servers. By having visibility into your event pipelines with Datadog, you are quickly alerted so you can investigate issues and explore these inconsistencies—before they start affecting your customers.
Deep visibility into your Segment pipelines

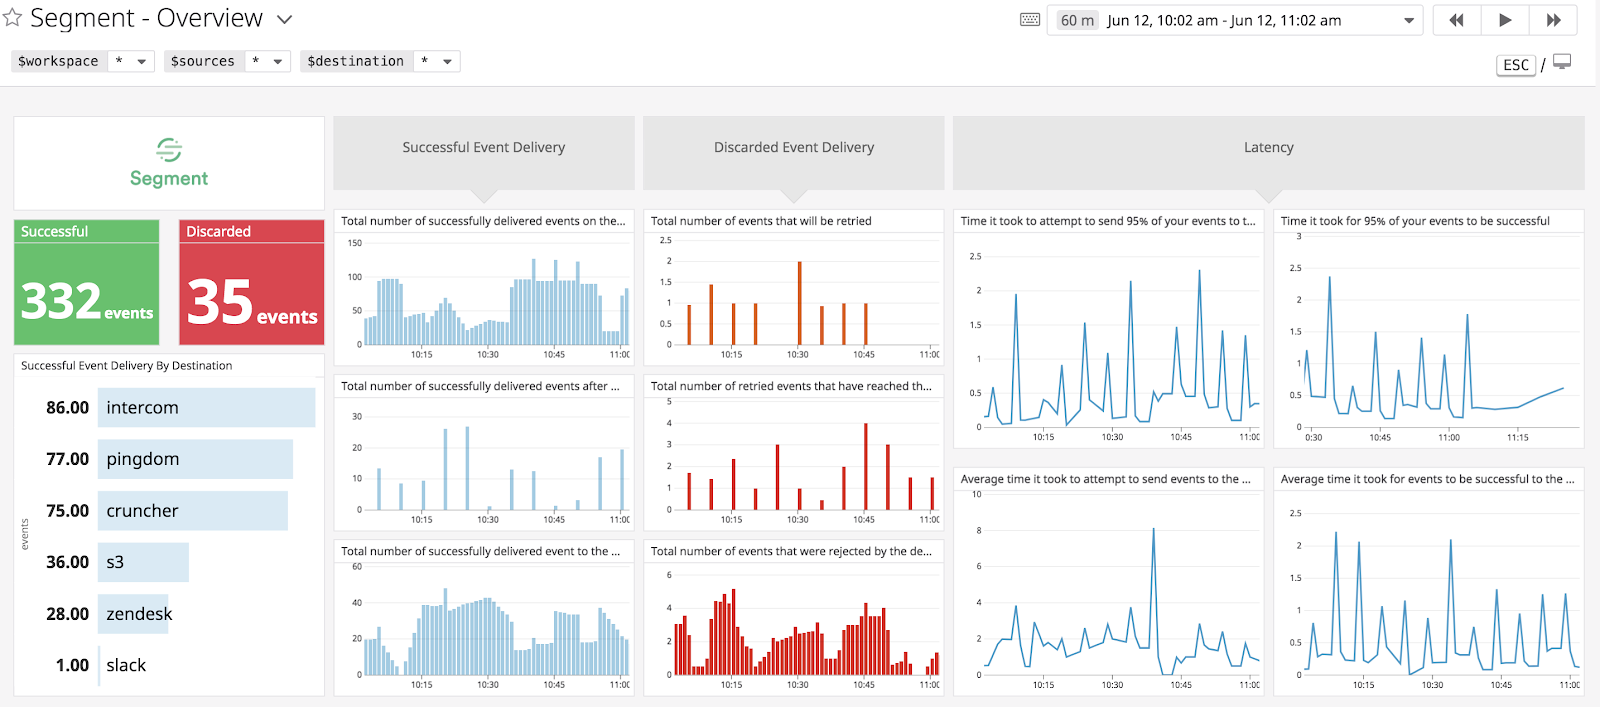
With Datadog's out-of-the-box dashboard, you can visualize Segment event delivery metrics for all of your cloud mode Destinations. You can get an overview of successful, discarded, and rejected deliveries as well as delivery latency so that you can quickly assess the health and performance of your Segment pipelines. Datadog tags all of your Segment metrics by workspace, Source, and Destination, so you can use the template variables to filter your view of the dashboard to get more precise insights into the health of your pipelines.
While this template dashboard provides a great starting point for monitoring your Segment pipelines, you can clone and customize it by adding other key metrics that are important to your team.
Identify trends in your pipelines
To visualize trends in the health and performance of your Segment pipelines, you can apply Datadog's machine learning–powered forecasting or anomaly detection algorithms to any event delivery metric.

As seen in the example above, you can use anomaly detection to identify any abnormal fluctuations in event delivery latency, based on historical trends.
Datadog's Segment integration helps you investigate anomalies in your Segment pipelines by correlating them with monitoring data from the other technologies in your stack. For example, this anomalous spike in latency of event deliveries to a specific Destination could indicate an issue with your servers or a network outage. With Datadog, you can correlate these types of incidents with the health of the server and network to find the root cause. Datadog also provides integrations for Segment Destinations such as Amazon Redshift and S3, so you can build comprehensive dashboards for your infrastructure.
Automatically get notified about rejected deliveries
In addition to using dashboards to track the health of your Segment pipelines, you can create custom alerts to automatically notify your team of critical issues with event deliveries to one or more of your Destinations.
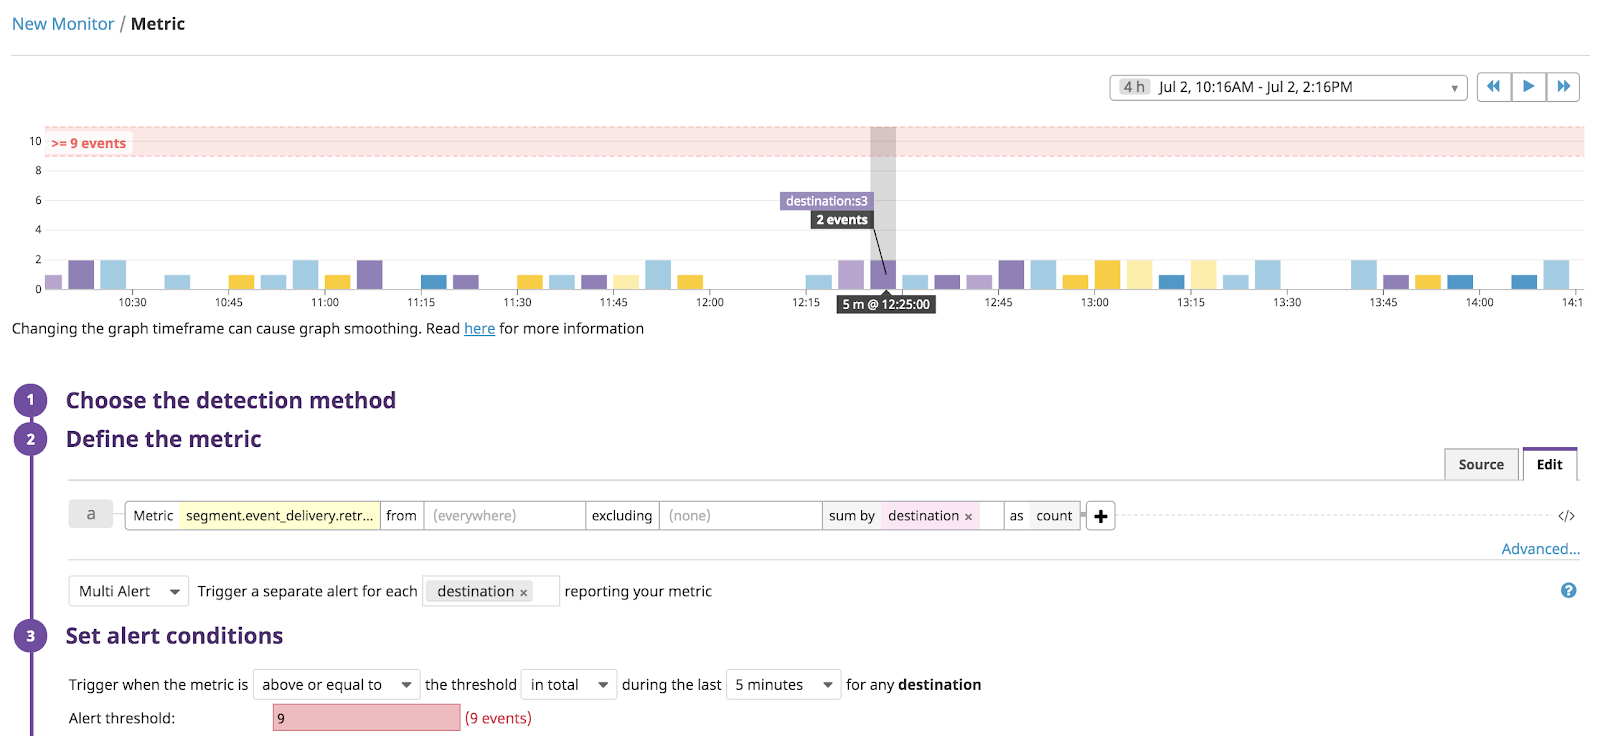
For instance, you can set up an alert to notify you of a spike in the total number of events that were rejected by a Destination (`segment.event_delivery.retried`), which could point to issues with rate limiting or a configuration error for a specific Destination such as Pingdom.

Since Segment retries delivering events to Destinations up to nine times, you may want to set up an alert to detect when it reaches this threshold. If the total number of events rejected by any Destination reaches this threshold, you will receive a notification that contains more details about the Source and Destination that triggered the alert so you can troubleshoot the issue more efficiently.
Enable the Datadog integration
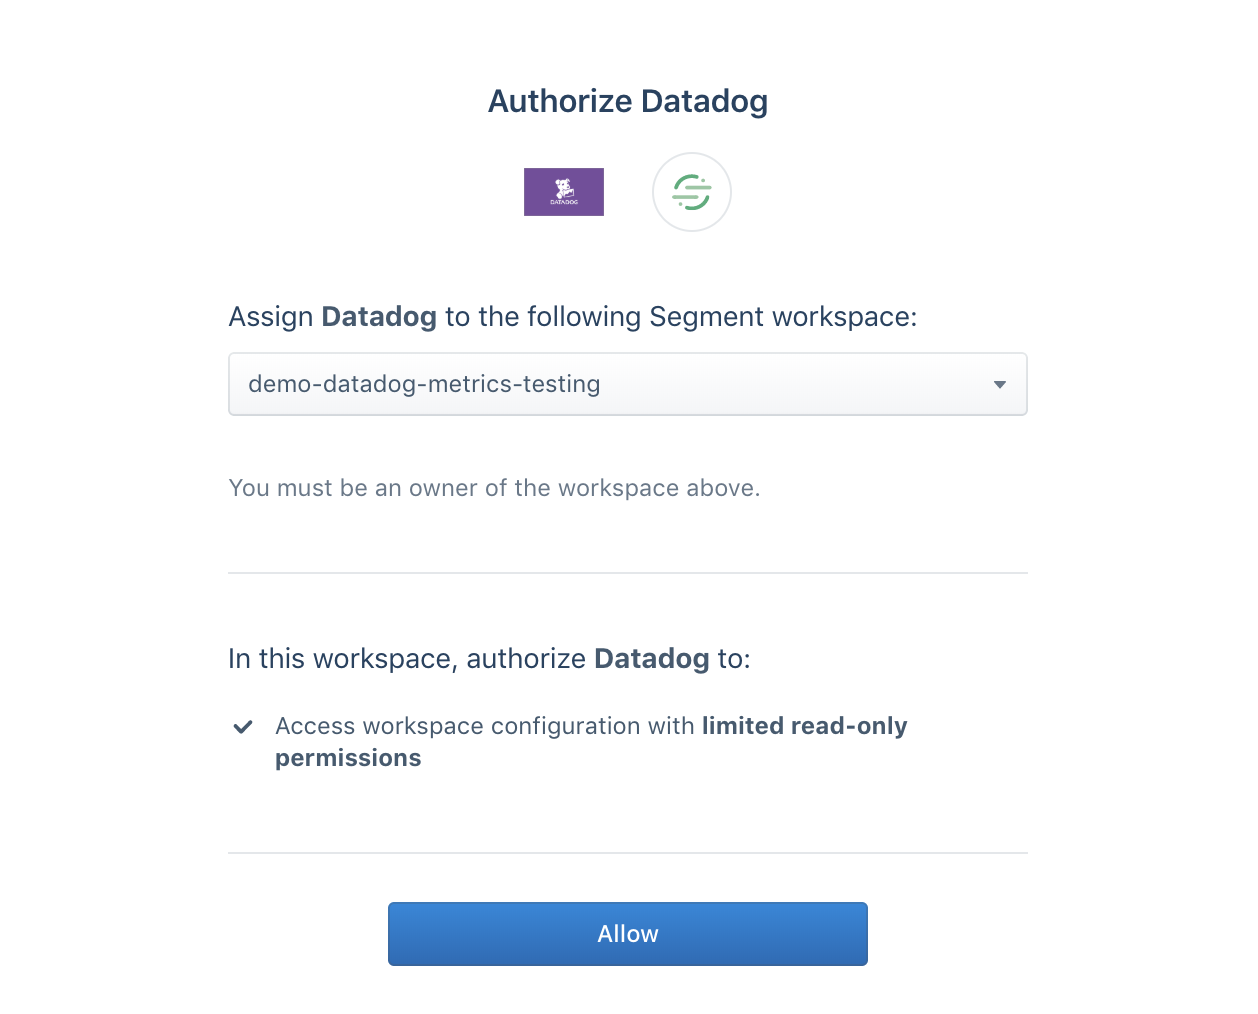
To start visualizing and alerting on your Segment pipelines with this integration, you'll need to grant Datadog read-only access to each workspace you want to monitor. If you're not yet using Datadog, you can get started with a free trial. In your Datadog account, navigate to the Segment integration tile and click on the "Add Workspace" link. This will redirect you to log into your Segment account and authorize access to your desired workspace.

Within minutes, you should be able to see data from your Segment pipelines flowing into your out-of-the-box dashboard. You can filter this data based on workspace, Source, and Destination, track these metrics in custom dashboards, and set up alerts to proactively monitor the performance of your event deliveries.
Integrate Segment with Datadog
With Datadog's new Segment integration, you can get real-time visibility into the health of your Segment pipelines alongside other technologies in your stack. If you already have a Datadog account, you can learn more about the Segment integration and collected metrics by checking out our documentation. And if you’re not yet using Datadog, you can start monitoring your events alongside the rest of your infrastructure and applications by signing up for a 14-day trial.

The State of Personalization 2023
Our annual look at how attitudes, preferences, and experiences with personalization have evolved over the past year.