How to Prevent Data Discrepancies Before They Occur
Data discrepancies can wreak havoc on your business. Here is how to prevent this from occurring.
By Segment
Data discrepancies can wreak havoc on your business. Here is how to prevent this from occurring.
You collect thousands of data objects each day. They come from a dozen sources and pass through different transformation layers before reaching your business intelligence software. What could go wrong?
As it turns out, a lot. One software’s timestamps could be in the wrong time zone. Some data may be duplicated, while other data fails to load. Bots may go undetected and skew your data set. Product and marketing can’t agree on what an “active user” means – and the CEO has a different definition too.
These mishaps cause data discrepancies, leading teams to question the quality and integrity of your organization’s data. As a result, projects end up delayed, or worse: people ignore the data and rely only on their gut instead.
In a survey of 500 data engineers, analysts, and scientists, 77% said their organization has data quality issues. Almost all respondents (91%) said poor data quality was impacting business performance.
To avoid this scenario, it’s important to take a proactive approach to prevent data discrepancies. Here’s how.
As its name suggests, a data discrepancy is when two corresponding data sets don’t match (like two analytics platforms reporting different bounce rates for the same landing page).
If you collect data from several SaaS tools and online platforms, you’ll inevitably see some data discrepancies. That’s because few tools – if any – use the same schema, tracking mechanism, and criteria for actions and metrics. Still, you want to minimize and prevent data deviation. Some analytics tools recommend investigating discrepancies if they represent more than 5% of your data set, while others set a threshold of 10%.
Here’s a real (and all too common) story. Adevinta, a marketplace and classifieds company, was pulling data manually from more than 20 source apps. Departments used different dashboards, metrics, and data definitions. With disparate and inconsistent data sets, the company struggled to extract insights, attribute revenue, identify trends, and implement personalization. Every day, the engineering team spent 25% of their time fixing errors and problems caused by discrepancies.
Those missed insights, delayed decisions, and engineering hours add up to expenses and opportunity costs. In a survey of 1,200 CRM users, 44% of respondents estimated that poor-quality CRM data causes their company to lose over 10% of annual revenue. And Gartner estimated that, on average, poor data quality costs organizations $12.9 million.
Data discrepancies can be random or systemic. They may arise from human errors (like spelling mistakes) or from your tools’ faults (like loading failures).
Data sources typically have differences in tracking methods, naming conventions, and data definitions. For example, Adjust, a mobile marketing platform, counts an app install when a user opens an app for the first time. The Apple Store counts an install when a person downloads an app.
Other common differences and incompatibilities involve:
Metrics
Event locations
Time zones
Client-side vs. server-side tracking methods
The lack of standards is a systemic problem – one that can be fixed within an organization, but remains a problem when dealing with multiple software providers or fulfilling reporting requirements for different governing entities.
Insufficient data cleansing arises from weak data quality controls and a lack of tools for automating data diagnostics. This leads to loopholes that allow invalid data types, syntax errors, incomplete data, and duplicates to enter and pollute your data store.
You may also see discrepancies when one analytics tool filters out bot clicks while another doesn’t. A data pipeline may not have the tools to automatically transform source data to match its destination’s schema, preventing some data objects from loading in your analytics suite or data store.
Data sampling occurs when a tool analyzes a subset of your data to estimate results. Say you get 100,000 visitors daily, but your website analytics only examines 10,000 visits to calculate bounce rate. While sampling is a valid technique, the sample size and the method for choosing a sample may result in highly inaccurate estimates. The sample might not represent your overall audience for various reasons – say the tool analyzed only the first 10,000 visits or visits originating from a single time zone.
Analytics tools usually use sampling when you reach a certain data limit based on your payment plan. For massive data sets, sampling lets you conserve bandwidth and time.
Remember Adevinta? They resolved their data problems by centralizing data collection and setting up standards and controls to ensure data quality. Do the same to resolve and prevent data discrepancies in your organization.
In a company where teams keep data to themselves, marketing and sales don’t realize they’re using incompatible attribution models for the same campaigns. Product and customer support teams don’t know they’ve been defining disengaged users differently.
Such discrepancies surface when you consolidate data from multiple sources in a single repository, such as a customer data platform (CDP). Adevinta used Twilio Segment’s CDP to create a shared source of truth for their organization. They implemented universal standards, definitions, and tracking methods on data collected by different teams and tools. They ran automated audits and validation. We’ll go into more detail on these strategies in the next sections.
A tracking plan is a document that identifies the data events you’ll collect, along with their properties and naming conventions. It explains how tracking these events helps you achieve business goals, and discusses your tracking methods. When all departments in your organization adhere to one tracking plan, you prevent data discrepancies.
Here’s an excerpt from a simplified version of Segment’s tracking plan:
The plan gives you the naming convention for an event where a customer creates a Segment account, along with the property values. It explains why tracking account creation is important and specifies where this event should be collected. It also provides the code for event capture (not shown above, but you can see it and other details in this spreadsheet).
To drive company-wide adoption, make sure the tracking plan covers each team’s data collection requirements and use cases. Treat the plan as a living document that you change if you need to improve your data standards or track more event types as your business evolves.
Learn how to create a successful tracking plan and get specs for SaaS, mobile, e-commerce, and video tracking.
A data dictionary lists data elements and their definitions and attributes. Create one to end disagreements about what a particular event or metric means.
Get different departments involved in creating and enforcing your data dictionary. You’ll find that even common terms like “users” or “sessions” can trigger disputes. The process will take lots of time, coordination, and negotiation, but stick it out – it’s worth all the pain. When Adevinta adopted a single data dictionary, the organization improved data consistency and reduced implementation errors. The resulting alignment among teams and democratization of data governance increased operational efficiency by 10%.
Here’s an example of a data definition by Google Analytics:
Percent scrolled — “The percentage down the page that the user scrolled. If someone scrolls at least 90% of a page, the value '90' populates the dimension. Otherwise, the dimension is blank.”
Metrics and significant events like conversions require more details, such as how they’re calculated and how they’re related to other data objects. The example below shows how Meta defines “link click-through rate” on Facebook Ads:
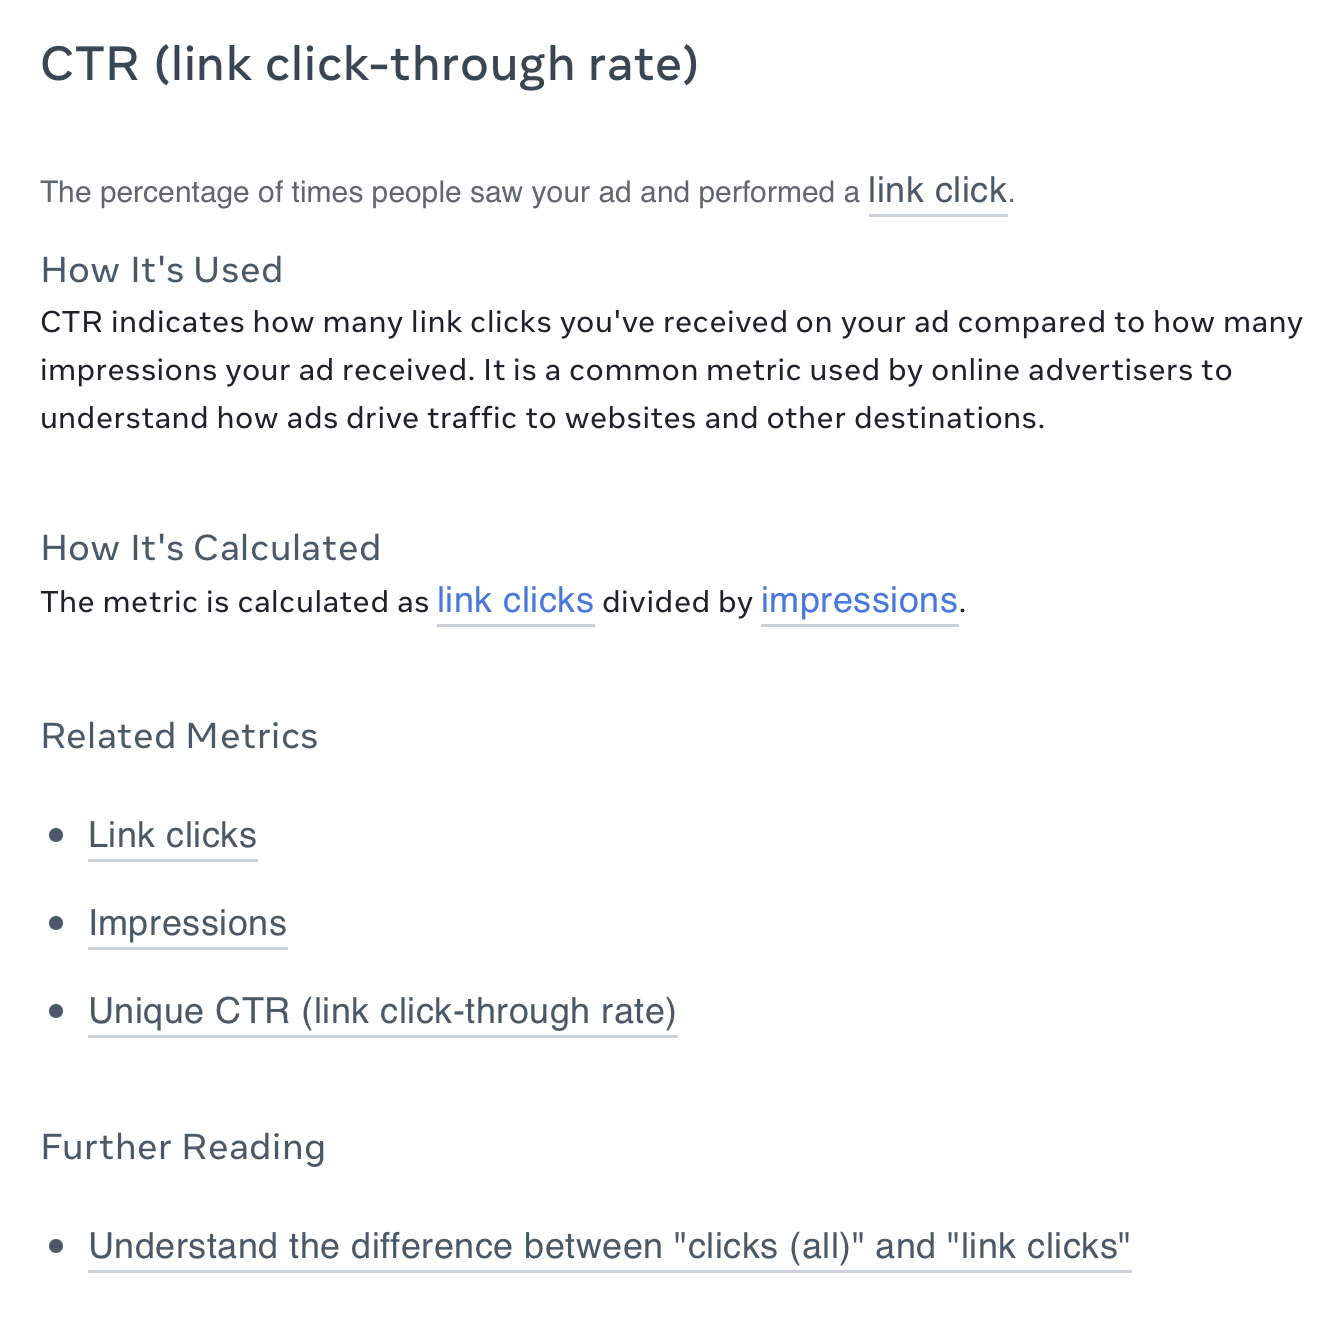
Like Meta did here, you can supplement data definitions by linking to related terms and providing resources that explain the difference between closely similar data objects. For terms that are often disputed, create and link to an internal resource that explains and defends the given definition.
If you track thousands of events a day, you know that maintaining data quality through manual checks and audits is impossible. You need to automate tasks like:
Flagging bad data (e.g., inaccurate, invalid, duplicate, incomplete)
Preventing bad data from being sent to data repositories and downstream tools
Transforming, cleaning, deduplicating, and validating data
You do this using a tool like Protocols, a data quality management feature from Segment. Protocols tells you when a tracked event doesn’t conform to your tracking plan – maybe because it uses a different naming style and input format, or contains incomplete or invalid properties. It cleans your data before sending it to your data warehouse, analytics tools, and business apps. With such automation, you resolve discrepancies as they happen and prevent them from tainting the quality of data in your data store.
See how Protocols works by requesting a free demo.

Our annual look at how attitudes, preferences, and experiences with personalization have evolved over the past year.
Centralize your data into one repository. With data in one place, you can compare data collected from different sources. You can run automated audits and validation on disparate data sets to identify discrepancies.
Data discrepancies may be random, systemic, human-caused, or tools-based errors.
Data discrepancies have many causes, including non-standardized naming conventions, different data definitions, lack of diagnostics, fraud, and incorrect data entry.
Twilio Segment's core product is a customer data platform (CDP), which lets you centralize all your customer data. Protocols, a feature built into Segment CDP, automates data quality diagnostics and validation. It enables you to stick with your tracking plan even as you collect thousands of data events across multiple sources.