Allocation efficiency in high-performance Go services

In this post we’ll cover common patterns that lead to inefficiency and production surprises related to memory allocation as well as practical ways of blunting or eliminating these issues. We’ll focus on the key mechanics of the allocator that provide developers a way to get a handle on their memory usage.

By Achille Roussel, Rick Branson

Memory management in Golang can be tricky, to say the least. However, after reading the literature, one might be led to believe that all the problems are solved: sophisticated automated systems that manage the lifecycle of memory allocation free us from these burdens.

However, if you’ve ever tried to tune the garbage collector of a JVM program or optimized the allocation pattern of a Go codebase, you understand that this is far from a solved problem. Automated memory management in Golang helpfully rules out a large class of errors, but that’s only half the story. The hot paths of our software must be built in a way that these systems can work efficiently.

We found inspiration to share our learnings in this area while building a high-throughput service in Go called Centrifuge, which processes hundreds of thousands of events per second. Centrifuge is a critical part of Segment’s infrastructure. Consistent, predictable behavior is a requirement. Tidy, efficient, and precise use of memory is a major part of achieving this consistency.

In this post we’ll cover common patterns that lead to inefficiency and production surprises related to memory allocation as well as practical ways of blunting or eliminating these issues. We’ll focus on the key mechanics of the allocator that provide developers a way to get a handle on their memory usage.

Tools of the Trade

Our first recommendation is to avoid premature optimization. Go provides excellent profiling tools that can point directly to the allocation-heavy portions of a code base. There’s no reason to reinvent the wheel, so instead of taking readers through it here, we’ll refer to this excellent post on the official Go blog. It has a solid walkthrough of using pprof for both CPU and allocation profiling. These are the same tools that we use at Segment to find bottlenecks in our production Go code, and should be the first thing you reach for as well.

Use data to drive your optimization!

Analyzing Our Escape

Go manages memory allocation automatically. This prevents a whole class of potential bugs, but it doesn’t completely free the programmer from reasoning about the mechanics of allocation. Since Go doesn’t provide a direct way to manipulate allocation, developers must understand the rules of this system so that it can be maximized for our own benefit.

If you remember one thing from this entire post, this would be it: stack allocation is cheap and heap allocation is expensive. Now let’s dive into what that actually means.

Go allocates memory in two places: a global heap for dynamic allocations and a local stack for each goroutine. Go prefers allocation on the stack — most of the allocations within a given Go program will be on the stack. It’s cheap because it only requires two CPU instructions: one to push onto the stack for allocation, and another to release from the stack.

Unfortunately not all data can use memory allocated on the stack. Stack allocation requires that the lifetime and memory footprint of a variable can be determined at compile time. Otherwise a dynamic allocation onto the heap occurs at runtime. malloc must search for a chunk of free memory large enough to hold the new value. Later down the line, the garbage collector scans the heap for objects which are no longer referenced. It probably goes without saying that it is significantly more expensive than the two instructions used by stack allocation.

The compiler uses a technique called escape analysis to choose between these two options. The basic idea is to do the work of garbage collection at compile time. The compiler tracks the scope of variables across regions of code. It uses this data to determine which variables hold to a set of checks that prove their lifetime is entirely knowable at runtime. If the variable passes these checks, the value can be allocated on the stack. If not, it is said to escape, and must be heap allocated.

The rules for escape analysis aren’t part of the Go language specification. For Go programmers, the most straightforward way to learn about these rules is experimentation. The compiler will output the results of the escape analysis by building with go build -gcflags '-m'. Let’s look at an example:
package main

import "fmt"

func main() {
    x := 42
    fmt.Println(x)
}
$ go build -gcflags '-m' ./main.go
# command-line-arguments
./main.go:7: x escapes to heap
./main.go:7: main ... argument does not escape

See here that the variable xescapes to the heap,” which means it will be dynamically allocated on the heap at runtime. This example is a little puzzling. To human eyes, it is immediately obvious that x will not escape the main() function. The compiler output doesn’t explain why it thinks the value escapes. For more details, pass the -m option multiple times, which makes the output more verbose:

$ go build -gcflags '-m -m' ./main.go
# command-line-arguments
./main.go:5: cannot inline main: non-leaf function
./main.go:7: x escapes to heap
./main.go:7:         from ... argument (arg to ...) at ./main.go:7
./main.go:7:         from *(... argument) (indirection) at ./main.go:7
./main.go:7:         from ... argument (passed to call[argument content escapes]) at ./main.go:7
./main.go:7: main ... argument does not escape

Ah, yes! This shows that x escapes because it is passed to a function argument which escapes itself — more on this later.

The rules may continue to seem arbitrary at first, but after some trial and error with these tools, patterns do begin to emerge. For those short on time, here’s a list of some patterns we’ve found which typically cause variables to escape to the heap:

  • Sending pointers or values containing pointers to channels. At compile time there’s no way to know which goroutine will receive the data on a channel. Therefore the compiler cannot determine when this data will no longer be referenced.

  • Storing pointers or values containing pointers in a slice. An example of this is a type like []*string. This always causes the contents of the slice to escape. Even though the backing array of the slice may still be on the stack, the referenced data escapes to the heap.

  • Backing arrays of slices that get reallocated because an append would exceed their capacity. In cases where the initial size of a slice is known at compile time, it will begin its allocation on the stack. If this slice’s underlying storage must be expanded based on data only known at runtime, it will be allocated on the heap.

  • Calling methods on an interface type. Method calls on interface types are a dynamic dispatch — the actual concrete implementation to use is only determinable at runtime. Consider a variable r with an interface type of io.Reader. A call to r.Read(b) will cause both the value of r and the backing array of the byte slice b to escape and therefore be allocated on the heap.

In our experience these four cases are the most common sources of mysterious dynamic allocation in Go programs. Fortunately there are solutions to these problems! Next we’ll go deeper into some concrete examples of how we’ve addressed memory inefficiencies in our production software.

Some Pointers

The rule of thumb is: pointers point to data allocated on the heap. Ergo, reducing the number of pointers in a program reduces the number of heap allocations. This is not an axiom, but we’ve found it to be the common case in real-world Go programs.

It has been our experience that developers become proficient and productive in Go without understanding the performance characteristics of values versus pointers. A common hypothesis derived from intuition goes something like this: “copying values is expensive, so instead I’ll use a pointer.” However, in many cases copying a value is much less expensive than the overhead of using a pointer. “Why” you might ask?

  • The compiler generates checks when dereferencing a pointer. The purpose is to avoid memory corruption by running panic() if the pointer is nil. This is extra code that must be executed at runtime. When data is passed by value, it cannot be nil.

  • Pointers often have poor locality of reference. All of the values used within a function are collocated in memory on the stack. Locality of reference is an important aspect of efficient code. It dramatically increases the chance that a value is warm in CPU caches and reduces the risk of a miss penalty during prefetching.

  • Copying objects within a cache line is the roughly equivalent to copying a single pointer. CPUs move memory between caching layers and main memory on cache lines of constant size. On x86 this is 64 bytes. Further, Go uses a technique called Duff’s device to make common memory operations like copies very efficient.

Pointers should primarily be used to reflect ownership semantics and mutability. In practice, the use of pointers to avoid copies should be infrequent. Don’t fall into the trap of premature optimization. It’s good to develop a habit of passing data by value, only falling back to passing pointers when necessary. An extra bonus is the increased safety of eliminating nil.

Reducing the number of pointers in a program can yield another helpful result as the garbage collector will skip regions of memory that it can prove will contain no pointers. For example, regions of the heap which back slices of type []byte aren’t scanned at all. This also holds true for arrays of struct types that don’t contain any fields with pointer types.

Not only does reducing pointers result in less work for the garbage collector, it produces more cache-friendly code. Reading memory moves data from main memory into the CPU caches. Caches are finite, so some other piece of data must be evicted to make room. Evicted data may still be relevant to other portions of the program. The resulting cache thrashing can cause unexpected and sudden shifts the behavior of production services.

Digging for Pointer Gold

Reducing pointer usage often means digging into the source code of the types used to construct our programs. Our service, Centrifuge, retains a queue of failed operations to retry as a circular buffer with a set of data structures that look something like this:

type retryQueue struct {
    buckets       [][]retryItem // each bucket represents a 1 second interval
    currentTime   time.Time
    currentOffset int
}

type retryItem struct {
    id   ksuid.KSUID // ID of the item to retry
    time time.Time   // exact time at which the item has to be retried
}

The size of the outer array in buckets is constant, but the number of items in the contained []retryItem slice will vary at runtime. The more retries, the larger these slices will grow. 

Digging into the implementation details of each field of a retryItem, we learn that KSUID is a type alias for [20]byte, which has no pointers, and therefore can be ruled out. currentOffset is an int, which is a fixed-size primitive, and can also be ruled out. Next, looking at the implementation of time.Time type[1]:

type Time struct {
    sec  int64
    nsec int32
    loc  *Location // pointer to the time zone structure
}

The time.Time struct contains an internal pointer for the loc field. Using it within the retryItem type causes the GC to chase the pointers on these structs each time it passes through this area of the heap.

We’ve found that this is a typical case of cascading effects under unexpected circumstances. During normal operation failures are uncommon. Only a small amount of memory is used to store retries. When failures suddenly spike, the number of items in the retry queue can increase by thousands per second, bringing with it a significantly increased workload for the garbage collector.

For this particular use case, the timezone information in time.Time isn’t necessary. These timestamps are kept in memory and are never serialized. Therefore these data structures can be refactored to avoid this type entirely:

type retryItem struct {
    id   ksuid.KSUID
    nsec uint32
    sec  int64
}

func (item *retryItem) time() time.Time {
    return time.Unix(item.sec, int64(item.nsec))
}

func makeRetryItem(id ksuid.KSUID, time time.Time) retryItem {
    return retryItem{
        id:   id,
        nsec: uint32(time.Nanosecond()),
        sec:  time.Unix(),
    }
}

Now the retryItem doesn’t contain any pointers. This dramatically reduces the load on the garbage collector as the entire footprint of retryItem is knowable at compile time[2].

Pass Me a Slice

Slices are fertile ground for inefficient allocation behavior in hot code paths. Unless the compiler knows the size of the slice at compile time, the backing arrays for slices (and maps!) are allocated on the heap. Let’s explore some ways to keep slices on the stack and avoid heap allocation.

Centrifuge uses MySQL intensively. Overall program efficiency depends heavily on the efficiency of the MySQL driver. After using pprof to analyze allocator behavior, we found that the code which serializes time.Time values in Go’s MySQL driver was particularly expensive.

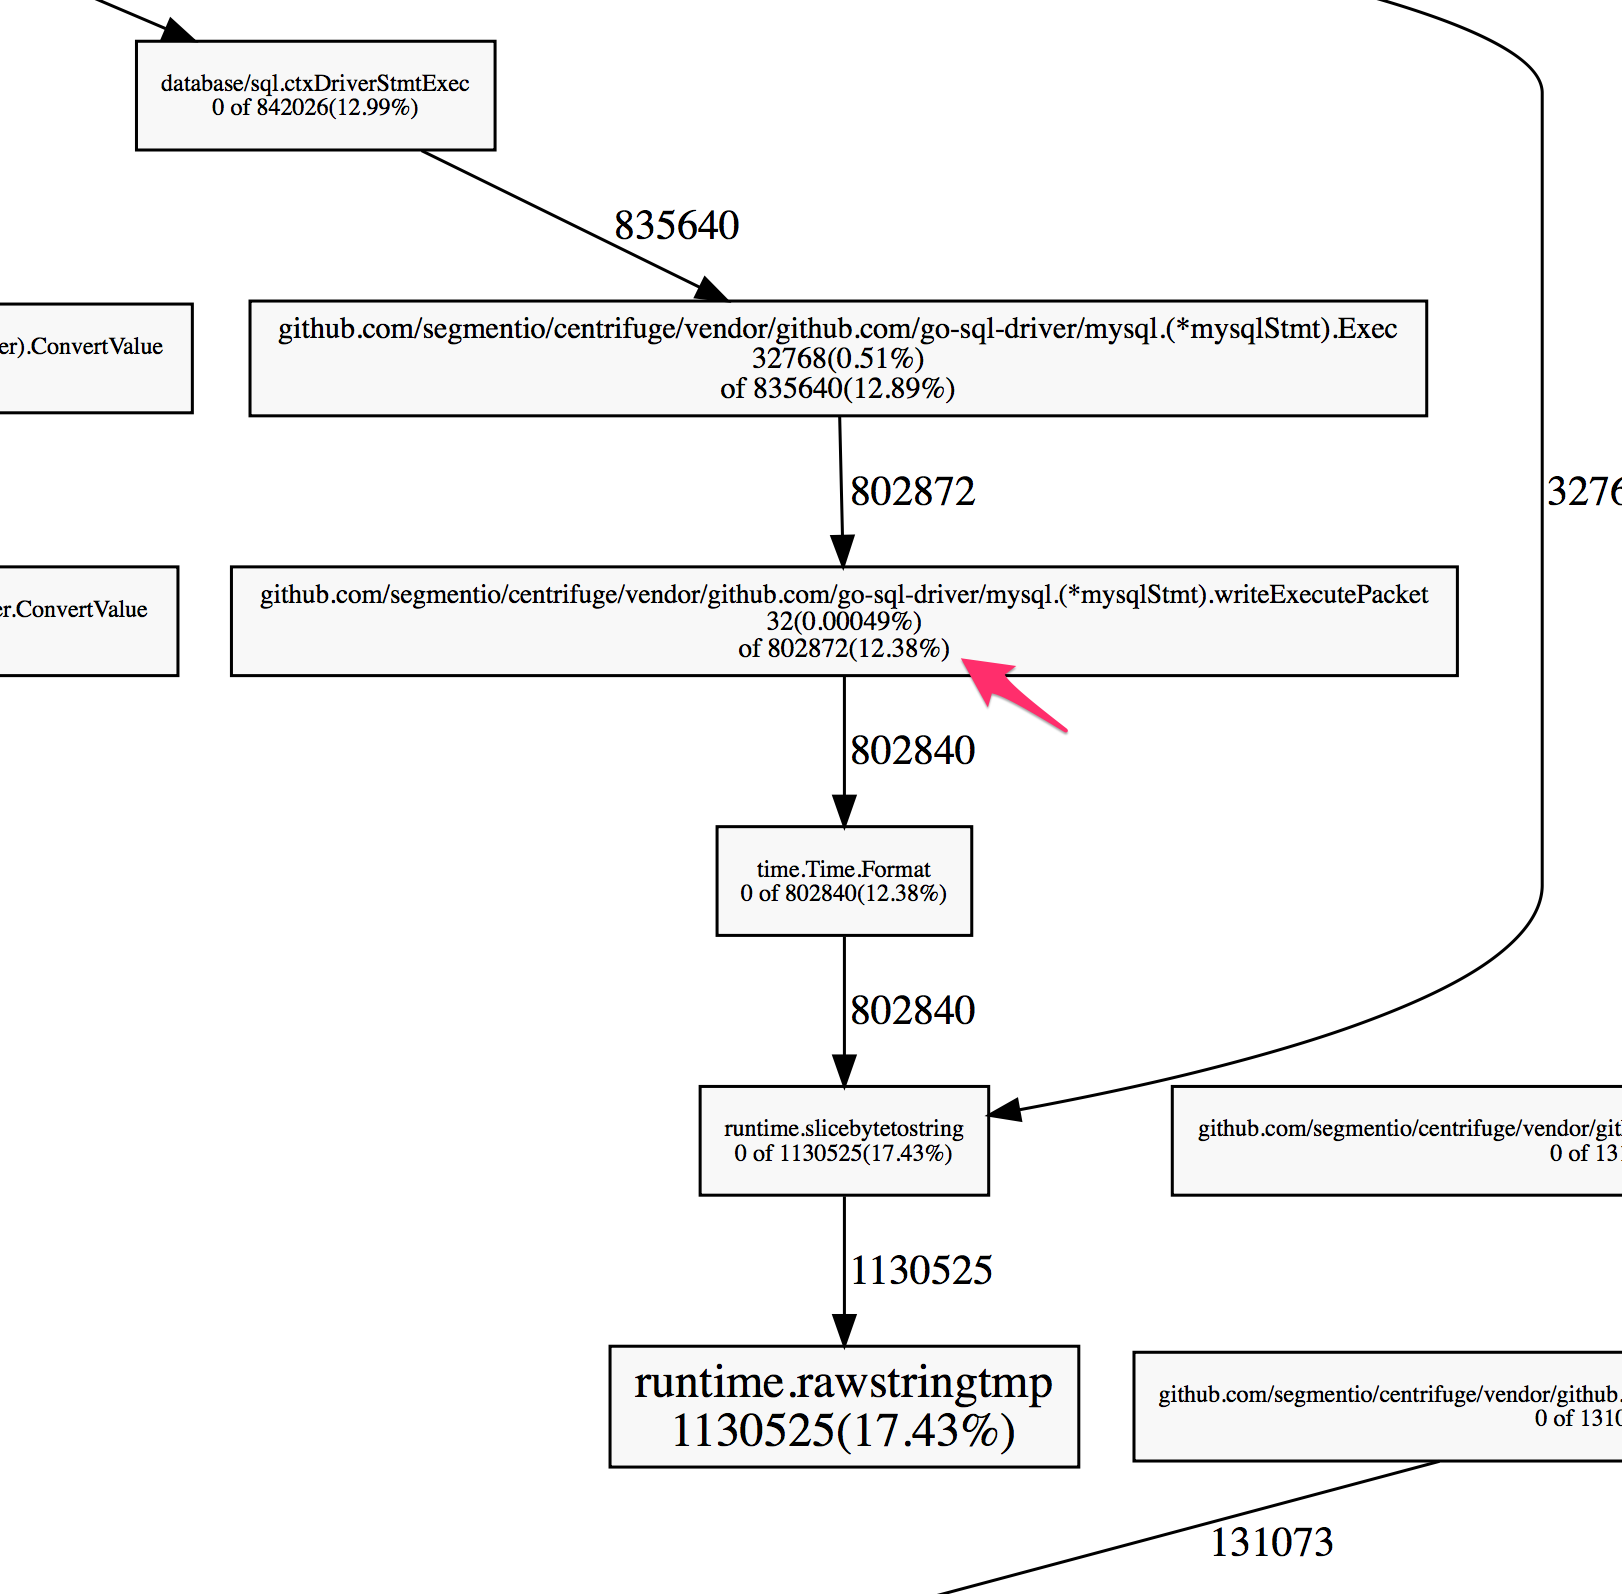
The profiler showed a large percentage of the heap allocations were in code that serializes a time.Time value so that it can be sent over the wire to the MySQL server.

asset_ognsdc07.png

This particular code was calling the Format() method on time.Time, which returns a string. Wait, aren’t we talking about slices? Well, according to the official Go blog, a string is just a “read-only slices of bytes with a bit of extra syntactic support from the language.” Most of the same rules around allocation apply!

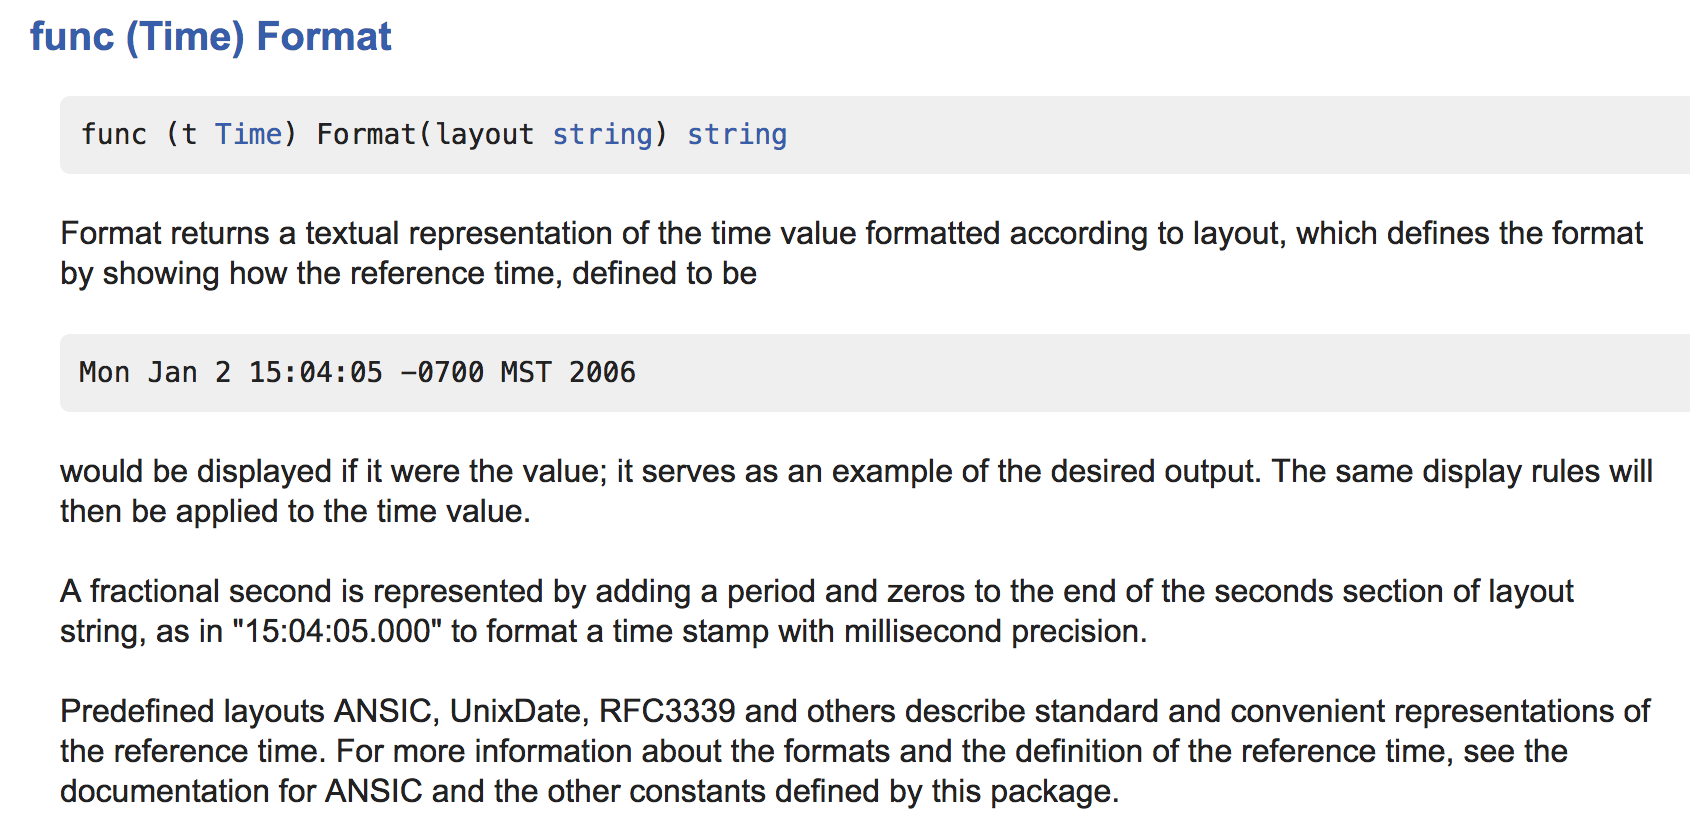
The profile tells us that a massive 12.38% of the allocations were occurring when running this Format method. What does Format do?

asset_VQwlrhJK.png

It turns out there is a much more efficient way to do the same thing that uses a common pattern across the standard library. While the Format() method is easy and convenient, code using AppendFormat() can be much easier on the allocator. Peering into the source code for the time package, we notice that all internal uses are AppendFormat() and not Format(). This is a pretty strong hint that AppendFormat() is going to yield more performant behavior.

asset_9IBZXwuO.png

In fact, the Format method just wraps the AppendFormat method:

func (t Time) Format(layout string) string {
    const bufSize = 64
    var b []byte
    max := len(layout) + 10
    if max < bufSize {
        var buf [bufSize]byte
        b = buf[:0]
    } else {
        b = make([]byte, 0, max)
    }
    b = t.AppendFormat(b, layout)
    return string(b)
}

Most importantly, AppendFormat() gives the programmer far more control over allocation. It requires passing the slice to mutate rather than returning a string that it allocates internally like Format(). Using AppendFormat() instead of Format() allows the same operation to use a fixed-size allocation[3] and thus is eligible for stack placement.

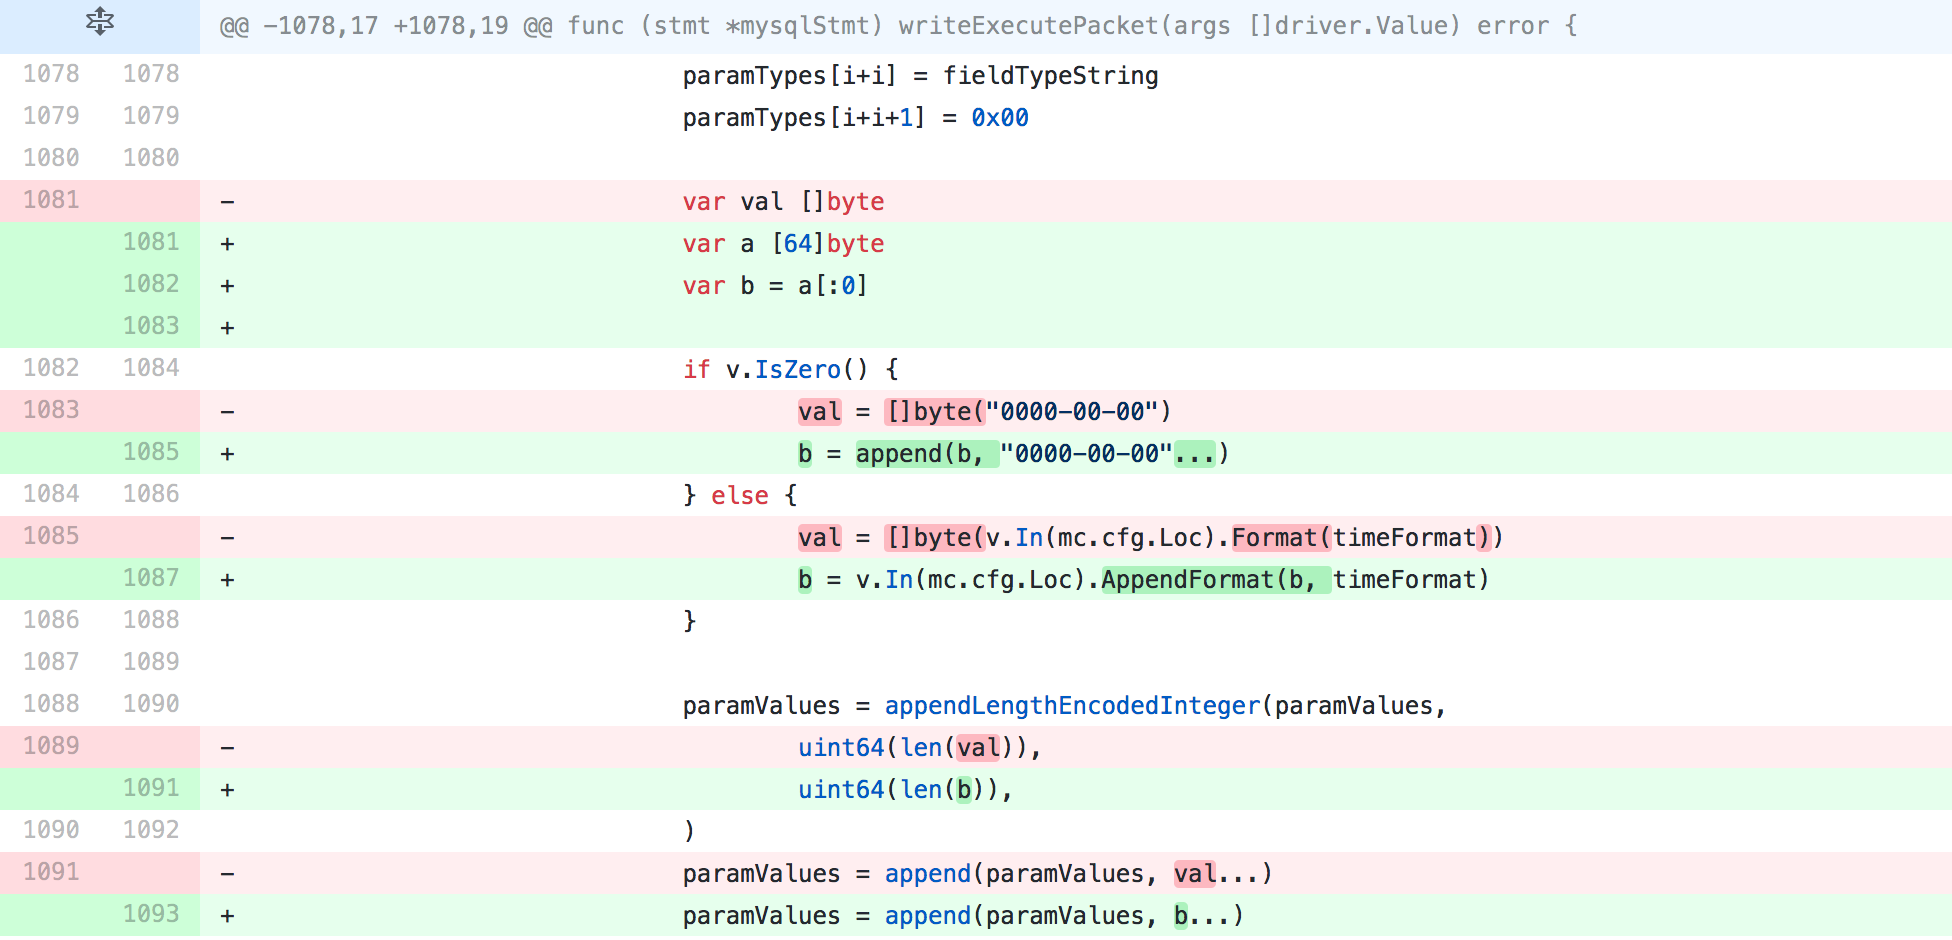
Let’s look at the change we upstreamed to Go’s MySQL driver in this PR.

asset_41Pq2hXv.png

The first thing to notice is that var a [64]byte is a fixed-size array. Its size is known at compile-time and its use is scoped entirely to this function, so we can deduce that this will be allocated on the stack.

However, this type can’t be passed to AppendFormat(), which accepts type []byte. Using the a[:0] notation converts the fixed-size array to a slice type represented by b that is backed by this array. This will pass the compiler’s checks and be allocated on the stack.

Most critically, the memory that would otherwise be dynamically allocated is passed to AppendFormat(), a method which itself passes the compiler’s stack allocation checks. In the previous version, Format() is used, which contains allocations of sizes that can’t be determined at compile time and therefore do not qualify for stack allocation.

The result of this relatively small change massively reduced allocations in this code path! Similar to using the “Append pattern” in the MySQL driver, an Append() method was added to the KSUID type in this PR. Converting our hot paths to use Append() on KSUID against a fixed-size buffer instead of the String() method saved a similarly significant amount of dynamic allocation. Also noteworthy is that the strconv package has equivalent append methods for converting strings that contain numbers to numeric types.

Interface Types and You

It is fairly common knowledge that method calls on interface types are more expensive than those on struct types. Method calls on interface types are executed via dynamic dispatch. This severely limits the ability for the compiler to determine the way that code will be executed at runtime. So far we’ve largely discussed shaping code so that the compiler can understand its behavior best at compile-time. Interface types throw all of this away!

Unfortunately interface types are a very useful abstraction — they let us write more flexible code. A common case of interfaces being used in the hot path of a program is the hashing functionality provided by standard library’s hash package. The hash package defines a set of generic interfaces and provides several concrete implementations. Let’s look at an example:

package main

import (
    "fmt"
    "hash/fnv"
)

func hashIt(in string) uint64 {
    h := fnv.New64a()
    h.Write([]byte(in))
    out := h.Sum64()
    return out
}

func main() {
    s := "hello"
    fmt.Printf("The FNV64a hash of '%v' is '%v'\n", s, hashIt(s))
}

Building this code with escape analysis output yields the following:

./foo1.go:9:17: inlining call to fnv.New64a
./foo1.go:10:16: ([]byte)(in) escapes to heap
./foo1.go:9:17: hash.Hash64(&fnv.s·2) escapes to heap
./foo1.go:9:17: &fnv.s·2 escapes to heap
./foo1.go:9:17: moved to heap: fnv.s·2
./foo1.go:8:24: hashIt in does not escape
./foo1.go:17:13: s escapes to heap
./foo1.go:17:59: hashIt(s) escapes to heap
./foo1.go:17:12: main ... argument does not escape

This means the hash object, input string, and the []byte representation of the input will all escape to the heap. To human eyes these variables obviously do not escape, but the interface type ties the compilers hands. And there’s no way to safely use the concrete implementations without going through the hash package’s interfaces. So what is an efficiency-concerned developer to do?

We ran into this problem when constructing Centrifuge, which performs non-cryptographic hashing on small strings in its hot paths. So we built the fasthash library as an answer. It was straightforward to build — the code that does the hard work is part of the standard library. fasthash just repackages the standard library code with an API that is usable without heap allocations.

Let’s examine the fasthash version of our test program:

package main

import (
    "fmt"
    "github.com/segmentio/fasthash/fnv1a"
)

func hashIt(in string) uint64 {
    out := fnv1a.HashString64(in)
    return out
}

func main() {
    s := "hello"
    fmt.Printf("The FNV64a hash of '%v' is '%v'\n", s, hashIt(s))
}

And the escape analysis output?

./foo2.go:9:24: hashIt in does not escape
./foo2.go:16:13: s escapes to heap
./foo2.go:16:59: hashIt(s) escapes to heap
./foo2.go:16:12: main ... argument does not escape

The only remaining escapes are due to the dynamic nature of the fmt.Printf() function. While we’d strongly prefer to use the standard library from an ergonomics perspective, in some cases it is worth the trade-off to go to such lengths for allocation efficiency.

One Weird Trick

Our final anecdote is more amusing than practical. However, it is a useful example for understanding the mechanics of the compiler’s escape analysis. When reviewing the standard library for the optimizations covered, we came across a rather curious piece of code.

// noescape hides a pointer from escape analysis.  noescape is
// the identity function but escape analysis doesn't think the
// output depends on the input.  noescape is inlined and currently
// compiles down to zero instructions.
// USE CAREFULLY!
//go:nosplit
func noescape(p unsafe.Pointer) unsafe.Pointer {
    x := uintptr(p)
    return unsafe.Pointer(x ^ 0)
}

This function will hide the passed pointer from the compiler’s escape analysis functionality. What does this actually mean though? Well, let’s set up an experiment to see!

package main
import (
    "unsafe"
)

type Foo struct {
    S *string
}

func (f *Foo) String() string {
    return *f.S
}

type FooTrick struct {
    S unsafe.Pointer
}

func (f *FooTrick) String() string {
    return *(*string)(f.S)
}

func NewFoo(s string) Foo {
    return Foo{S: &s}
}

func NewFooTrick(s string) FooTrick {
    return FooTrick{S: noescape(unsafe.Pointer(&s))}
}

func noescape(p unsafe.Pointer) unsafe.Pointer {
    x := uintptr(p)
    return unsafe.Pointer(x ^ 0)
}

func main() {
    s := "hello"
    f1 := NewFoo(s)
    f2 := NewFooTrick(s)
    s1 := f1.String()
    s2 := f2.String()
}

This code contains two implementations that perform the same task: they hold a string and return the contained string using the String() method. However, the escape analysis output from the compiler shows us that the FooTrick version does not escape!

./foo3.go:24:16: &s escapes to heap
./foo3.go:23:23: moved to heap: s
./foo3.go:27:28: NewFooTrick s does not escape
./foo3.go:28:45: NewFooTrick &s does not escape
./foo3.go:31:33: noescape p does not escape
./foo3.go:38:14: main &s does not escape
./foo3.go:39:19: main &s does not escape
./foo3.go:40:17: main f1 does not escape
./foo3.go:41:17: main f2 does not escape

These two lines are the most relevant:

./foo3.go:24:16: &s escapes to heap
./foo3.go:23:23: moved to heap: s

This is the compiler recognizing that the NewFoo() function takes a reference to the string and stores it in the struct, causing it to escape. However, no such output appears for the function takes a reference to the string and stores it in the struct, causing it to escape. However, no such output appears for the NewFooTrick() function. If the call to noescape() is removed, the escape analysis moves the data referenced by the FooTrick struct to the heap. What is happening here?NewFooTrick() function. If the call to noescape() is removed, the escape analysis moves the data referenced by the FooTrick struct to the heap. What is happening here?

func noescape(p unsafe.Pointer) unsafe.Pointer {
    x := uintptr(p)
    return unsafe.Pointer(x ^ 0)
}

The noescape() function masks the dependency between the input argument and the return value. The compiler does not think that p escapes via x because the uintptr() produces a reference that is opaqueopaque to the compiler. The builtin uintptr type’s name may lead one to believe this is a bona fide pointer type, but from the compiler’s perspective it is just an integer that just happens to be large enough to store a pointer. The final line of code constructs and returns an unsafe.Pointer value from a seemingly arbitrary integer value. Nothing to see here folks! to the compiler. The builtin uintptr type’s name may lead one to believe this is a bona fide pointer type, but from the compiler’s perspective it is just an integer that just happens to be large enough to store a pointer. The final line of code constructs and returns an unsafe.Pointer value from a seemingly arbitrary integer value. Nothing to see here folks!

noescape() is used in dozens of functions in the runtime package that use unsafe.Pointer. It is useful in cases where the author knows for certain that data referenced by an unsafe.Pointer doesn’t escape, but the compiler naively thinks otherwise.

Just to be clear — we’re not recommending the use of such a technique. There’s a reason why the package being referenced is called unsafe and the source code contains the comment “USE CAREFULLY!”

Takeaways

Building a state-intensive Go service that must be efficient and stable under a wide range of real world conditions has been a tremendous learning experience for our team. Let’s review our key learnings:

  1. Don’t prematurely optimize! Use data to drive your optimization work.

  2. Stack allocation is cheap, heap allocation is expensive.

  3. Stack allocation is cheap, heap allocation is expensive.

  4. Understanding the rules of escape analysis allows us to write more efficient code.

  5. Pointers make stack allocation mostly infeasible.

  6. Look for APIs that provide allocation control in performance-critical sections of code.

  7. Use interface types sparingly in hot paths.

  8. Understanding the rules of escape analysis allows us to write more efficient code.

  9. Pointers make stack allocation mostly infeasible.

  10. Look for APIs that provide allocation control in performance-critical sections of code.

  11. Use interface types sparingly in hot paths.

We’ve used these relatively straightforward techniques to improve our own Go code, and hope that others find these hard-earned learnings helpful in constructing their own Go programs.

Happy coding, fellow gophers!

Notes

[1] The time.Timetime.Time struct type has changed in Go 1.9. struct type has changed in Go 1.9.

[2] You may have also noticed that we switched the order of the nsec and sec fields, the reason is that due to the alignment rules, Go would generate a 4 bytes padding after the KSUID. The nanosecond field happens to be 4 bytes so by placing it after the KSUID Go doesn’t need to add padding anymore because the fields are already aligned. This dropped the size of the data structure from 40 to 32 bytes, reducing by 20% the memory used by the retry queue.

[3] Fixed-size arrays in Go are similar to slices, but have their size encoded directly into their type signature. While most APIs accept slices and not arrays, slices can be made out of arrays!

The State of Personalization 2023

Our annual look at how attitudes, preferences, and experiences with personalization have evolved over the past year.

Recommended articles

Loading

Want to keep updated on Segment launches, events, and updates?