For an early startup, using the cloud isn’t even a question these days. No RFPs, provisioning orders, or physical shipments of servers. Just the promise of getting up and running on “infinitely scalable” compute power within minutes.
But, the ability to provision thousands of dollars worth of infrastructure with a single API call comes with a very large hidden cost. And it’s something you won’t find on any pricing page.
Because outsourcing infrastructure is so damn easy (RDS, Redshift, S3, etc), it’s easy to fall into a cycle where the first response to any problem is to spend more money__.
And if your startup is trying to move as quickly as possible, the company may soon be staring at a five, six, or seven figure bill at the end of every month.
At Segment, we found ourselves in a similar situation near the end of last year. We were hitting the classic startup scaling problems, and our costs were starting to grow a bit too quickly. So we decided to focus on reducing the primary contributor: our AWS bill.
After a three months of focused work, we managed to cut our AWS bill by over one million dollars annually. Here is the story of how we did it.
Cash rules everything around me
Before diving in, it’s worth explaining the business reasons that really pushed us to build discipline around our infrastructure costs.
The costs for most SaaS products tend to find economies of scale early. If you are just selling software, distribution is essentially free, and you can support millions of users after the initial development. But the cost for infrastructure-as-a-service products (like Segment) tends to grow linearly with adoption. Not sub-linearly.
As a concrete example: a single Salesforce server supports thousands or millions of users, since each user generates a handful of requests per second. A single Segment container, on the other hand, has to process thousands of messages per second–all of which may come from a single customer.
By the end of Q3 2016, two thirds of our cost of goods sold (COGS) was the bill from AWS. Here’s the graph of the spend on a monthly basis, normalized against our May spend.
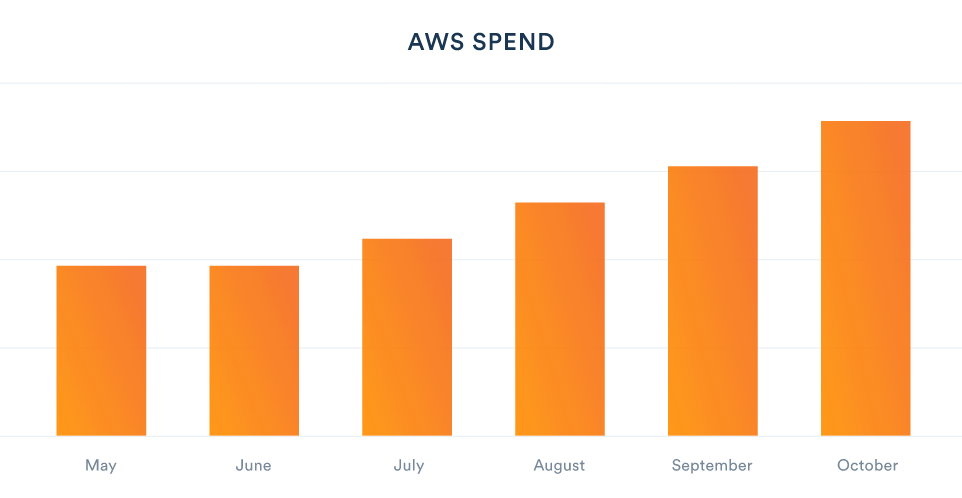
Our infrastructure cost was unacceptably high, and starting to impact our efforts to create a sustainable long-term business. It was time for a change.
Getting a lay of the land
If the first step in cost reduction is “admitting you have a problem”, the second is “identifying potential savings.” And with AWS, that turns out to be a surprisingly hard thing to do.
How do you determine the costs of an environment that is billed hourly with blended annual commits, auto-scaling instances, and bandwidth costs?
There are plenty of tools out there that promise to help optimize your infrastructure spend, but let’s get this out of the way: there is no magic bullet.
In our case, this meant digging through the bill line-by-line and scrutinizing every single resource.
To do this, we enabled AWS Detailed billing. It dumps the full raw logs of instance-hours, provisioned databases, and all other resources into S3. In turn, we then imported that data into Redshift using Heroku’s AWSBilling worker for further analysis.
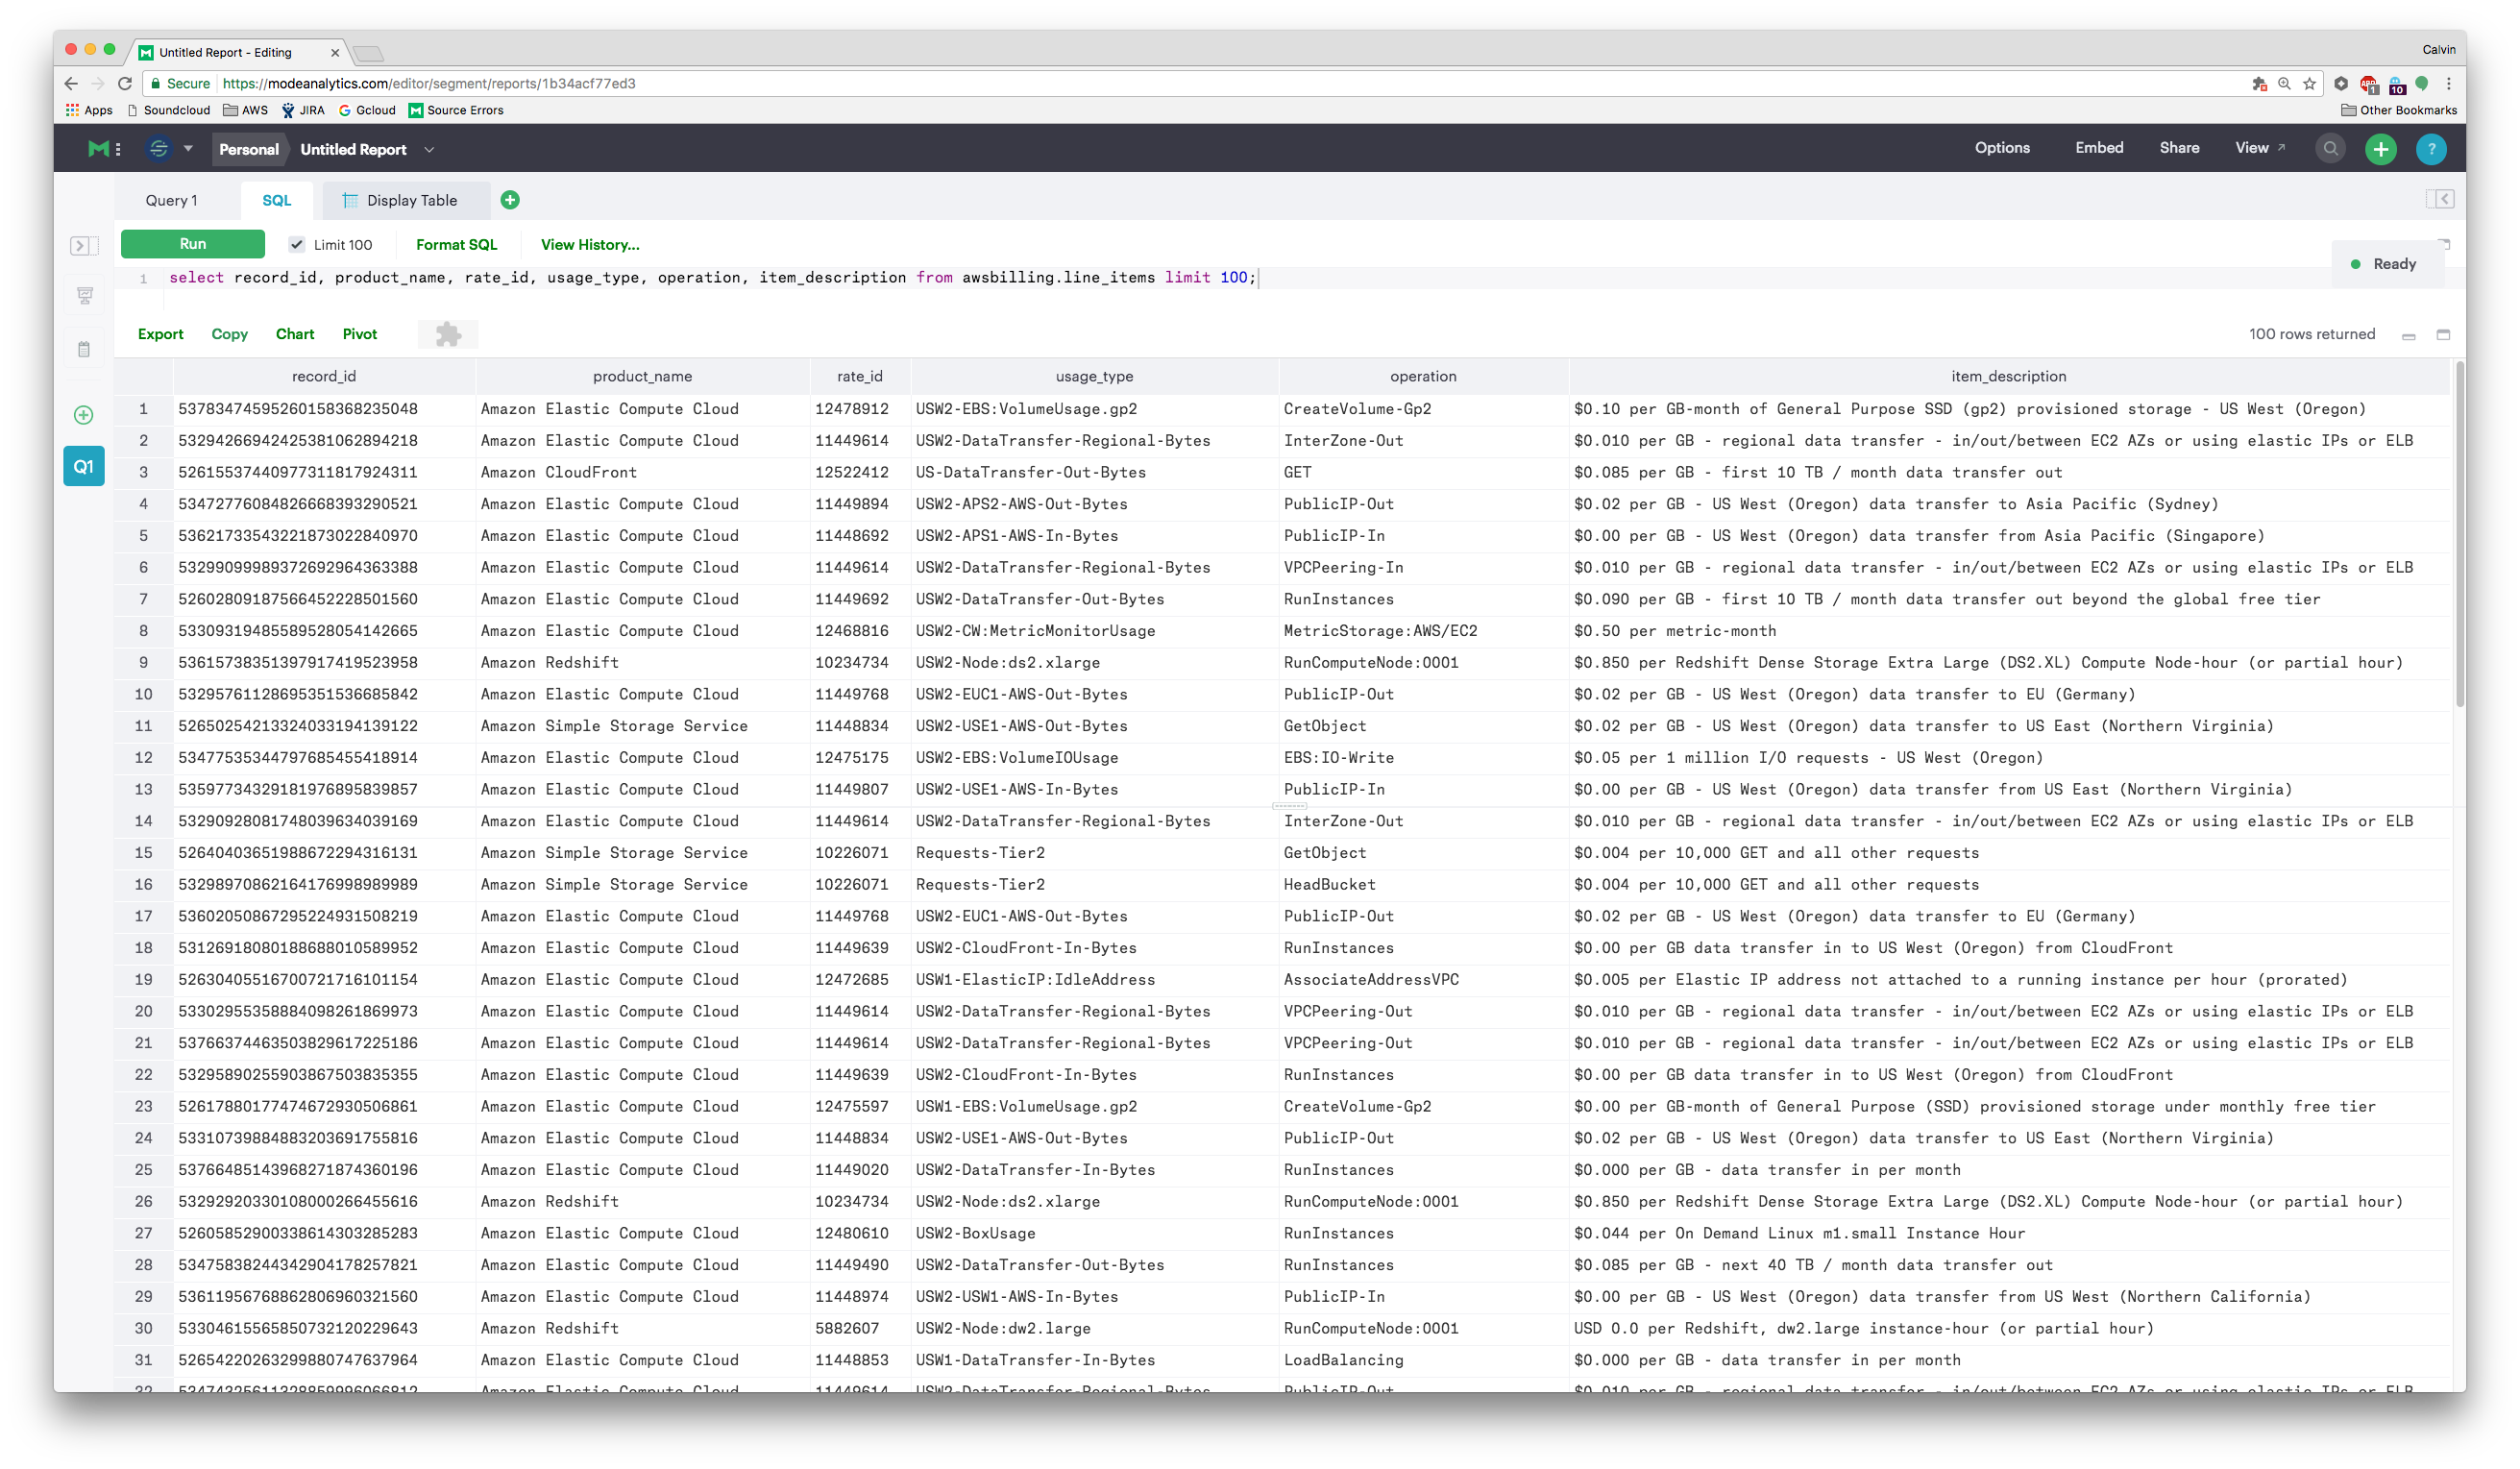
It was a messy dataset, but some deep analysis netted a list of the top ~15 problem areas, which totaled up to around 40% of our monthly bill.
Some issues were fairly pedestrian: hundreds of large EBS drives, over-provisioned cache and RDS instances. Relics left over from incidents of increased load that had not been sized back down.
But some issues required clear investment and dedicated engineering effort to solve. Of these, there were three fixes which stood out to us above all else:
-
DynamoDB hot shards ($300,000 annually)
-
Service auto-scaling ($60,000 annually)
-
Bin-packing and consolidating instance types ($240,000 annually)
The long-tail of cost reductions accounted for the remaining $400,000/year. And while there were a handful of lessons from eliminating those pieces, we’ll focus on the top three.
DynamoDB hot shards
Segment makes heavy use of DynamoDB for various parts of our processing pipeline. Dynamo is Amazon’s hosted version of Cassandra–it’s a NoSQL database that acts as a combination K/V and document store. It has support for secondary indexes to do multiple queries and scans efficiently, and abstracts away the underlying partitioning and replication schemes.
The Dynamo pricing model works in terms of throughput. As a user, you pay for a certain capacity on a given table (in terms of reads and writes per second), and Dynamo will throttle any reads or writes that go over your capacity. At face value, it feels like a fairly straightforward model: the more you pay, the more throughput you get.
However, correctly provisioning the throughput required is a bit more nuanced, and requires understanding what’s going on under the hood.
According to the official documentation, DynamoDB servers split partitions based upon a consistent hashing scheme:
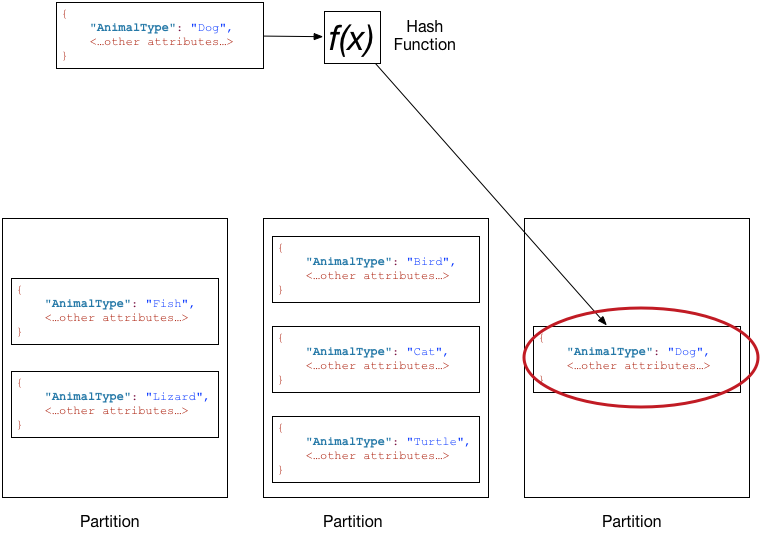
Under the hood, that means that all writes for a given key will go to the same server and same partition.
Now, it makes common sense that we should distribute reads and writes so they are uniformly distributed. You don’t want a hot partition or single server which is being constantly overloaded with writes, while your other servers are sitting idle.
Unfortunately, we were seeing a ton of throttling even though we’d provisioned significantly more capacity on our DynamoDB instances.
To get an understanding of the upstream events, our dynamo setup looks something like this:
We have a bunch of unpartitioned, randomly distributed queues that are read by multiple consumers. These objects are then written into Dynamo. If Dynamo slowed down, it would cause the entire queue to back up. And what’s more, we would have to increase throughput capacity far more significantly than the required write throughput in order to drain the queue.
What had us confused was that our keys are partitioned by the end tracked user. And tracking keys across hundreds of millions of users per day should evenly distribute the write load uniformly. We’d followed the exact recommendation from the AWS documentation:
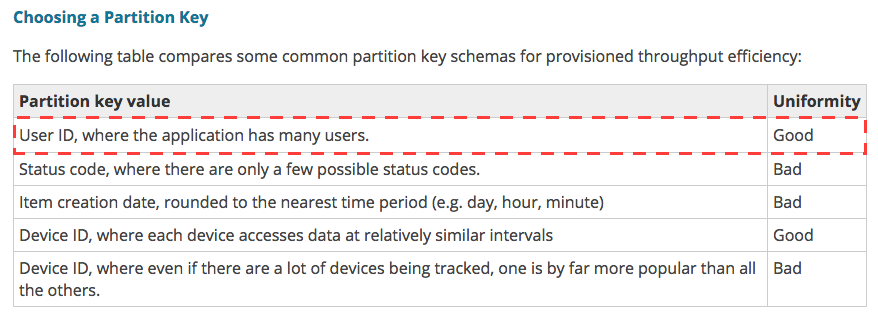
So why was Dynamo still getting throttled? It appeared there were two answers.
The first was the fact that the throughput pricing for dynamo actually dictates the number of partitions rather than the total throughput.
It’s easy to overlook, but the Amazon DynamoDB docs state the following when it comes to partitions:
The implication here is that you aren’t paying for total throughput, but rather partition count. And if you happen to have a few keys which saturate the same individual partitions, you have to double capacity to split a single hot partition onto their own partitions rather than scale the capacity linearly. And even there you are limited to the throughput for a single partition.
When we talked with the AWS team, their internal monitoring told a different story than our imagined ‘uniform distribution’. And it explained why we were seeing throughput far below what we had provisioned:

This is a heatmap they provided of the total partitions, along with the key pressure on each. The Y-axis maps partitions (we had 647 partitions on this table) and the X-access marks time over the course of the hour. More frequently accessed ‘hot’ partitions show up as red, while partitions that aren’t accessed show up as blue.
Vertical, non-blue, lines are good–they indicate that a bulk load happened, and was evenly spread across the keyspace, maximizing our throughput. However, if you look down at the 19th partition, you can see a thin streak of red:

Uh oh. We’d found our smoking gun: a single slow partition.
It was clear something needed to be done. The heat map they provided was a major key, but it’s granularity is at the partition-level, not the key. And unfortunately, there’s no provided out-of-the-box way to identify hot keys (hint hint!).
So we dreamt up a simple hack to give us the data we needed: anytime we were throttled by DynamoDB, we logged the key. The table’s provisioned capacity was temporarily reduced to induce the throttling behavior. And then logs were aggregated together and the top keys were extracted.
The findings? A number of keys that were the result of, shall-we-say, “creative” uses of Segment.
Here’s an example of what we were seeing:
Spot the issue?
At a certain time every day, it appeared as though there was a daily automated test against our production API that resulted in a burst of hundreds of thousands of events attached to a single userID (literallyuser_id in this case). And that userId that was either set statically, or incorrectly interpolated.
While we can fix bugs in our own code, we can’t control our customers.
It was clear from examining each case that there was no value in properly handling this data, so a set of blocked keys (“userId”, “user_id”, “#{user_id}” and variants) was built from the throttling logs. Over a few days we slowly decreased the provisioned capacity, blocking any new discovered badly behaved keys. Eventually we reduced capacity by 4x.
Of course, fixing individual partitions and blacklisting keys is only half the battle. We’re in the process of moving from NSQ to Kafka which will provide proper partitioning upstream of Dynamo. Partitioning upstream of Dynamo will ensure that we are batching writes efficiently and merging changes on a small subset of servers rather than spreading writes globally.
Service auto-scaling
A little bit of background on our stack: Segment adopted a micro-service architecture early on. We were among the first users of ECS (EC2 Container Service) for container orchestration, and Terraform for managing all of our AWS resources.
ECS manages all of our container scheduling. It’s a hosted AWS service, which requires each instance to run a local ECS-agent. You submit jobs to the ECS API, and it communicates with the agent running on each host to determine which containers should run on which instances.
When we first started using ECS, it was easy to auto-scale instances, but there was no convenient way to auto-scale individual containers.
The recommended approach was to build a frankensteinian pipeline of Cloudwatch alerts which would trigger a Lambda function that updated the ECS API. But in May 2016, the ECS team launched first class auto-scaling for services.
The approach is fairly simple. It’s effectively the same as the automated approach, but requires a lot fewer moving parts.
Step one: set limits on CPU and memory thresholds for the ECS service:

It takes about 30 seconds to do, and then the service will automatically scale the number of tasks up and down in relation to the amount of resources it’s using.
Step two: we enabled our instances to scale based upon the desired ECS resource allocation. That means if a cluster no longer had enough CPU or memory to place a given task, AWS would automatically add a new instance to the auto-scaling-group (ASG).
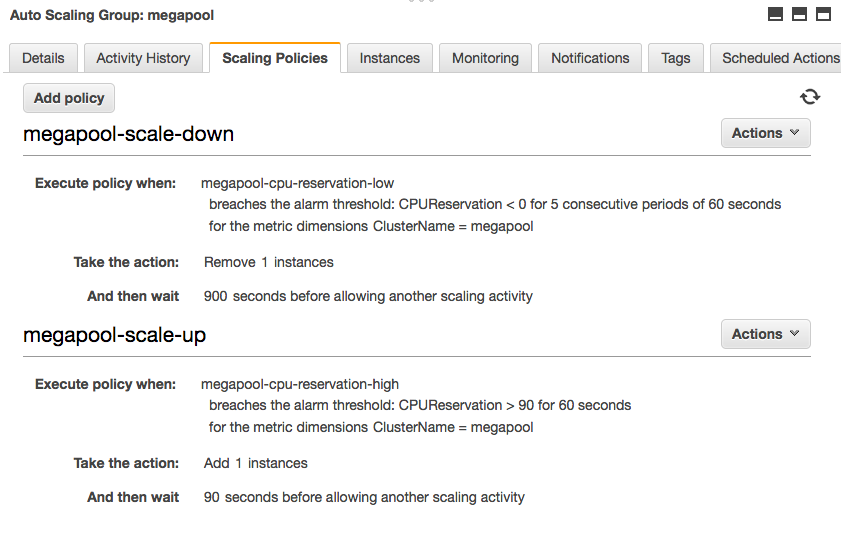
How are the results?
In practice this works really well (as modeled by our API containers):
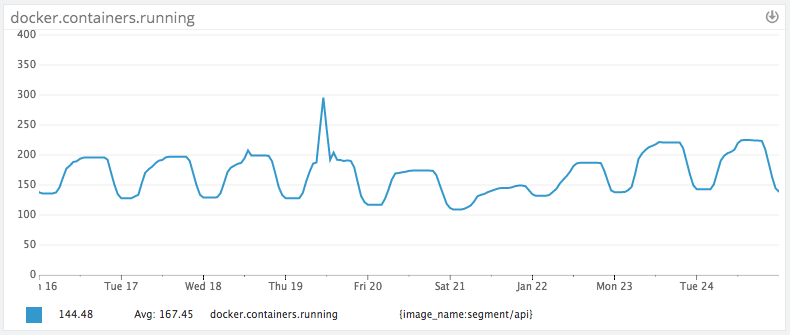
Our traffic load pretty closely follows the U.S. peaks and troughs (large rise at 9:00am EST). Because we only have 60% of peak traffic at nights and on weekends, we’ve been able to save substantially by adding auto-scaling, and not have to worry about sudden traffic spikes.
The additional benefit has been automatically scaling down after over-provisioning to deal with excess load. We no longer have to run at 2x the capacity, since the capacity is set dynamically. Which brings us to the last improvement: bin packing.
Bin packing and consolidating instance types
We’ve long contemplating switching to bigger instances, and then packing them with containers. But until we started on “project benjamin” (the internal name for our cost-cutting effort), we didn’t have a clear plan to get there.
There’s been a lot written about getting better performance from running on bigger virtual hosts. The general argument is that you can get less steal from noisy neighbors if you are the only one on a physical machine. And there’s more likelihood that you will be the sole VM on a physical machine if you are running at the largest possible instance size.
There’s a handful of additional benefits as well: fewer hosts means a lower cost of per-host monitoring and quicker image rollouts.
Moreover, if you are using the same instance type (big or small) you can get a much cheaper bill using reserved instances. Reserved instances are nearly 40% off the per-hour price, but require an annual commit.
So, we realized it was in our best interest to start consolidating the instances we were running on, and start building an army of c4.8xlarges (our workload is largely compute and I/O bound). But to get there, we needed a necessary requisite: moving off elastic load balancers (ELBs) to the new application load balancers (ALBs).
To understand what moving to ALBs gives us vs the classic ELB, it’s worth talking through how they work under the hood.
From our best estimation, ELBs are essentially built atop an army of small, auto-scaling instances running HAProxy.
When using ECS with ELBs, each container runs on a single host port specified by the service definition. The ELB then connects to that port and forwards traffic to each instance.
This has three major ramifications:
-
If you want to run more than one service on a given host, each service must listen on a unique port so they don’t collide.
-
You cannot run two containers of the same service on a single host because they will collide and attempt to listen on the same port. (no bin packing)
-
If you have n running containers, you must keep n+1 hosts available to deploy new containers (assuming that you want to maintain a 100% healthy containers during deploys).
In short, using ELBs in combination with ECS required us to over-provision instances and stack only a few services per instance. Hello cost city, population: us.
Fortunately for us, the port collision problem was solved with the introduction of the ALB.
The ALB allows ECS to set ports dynamically for individual containers, and then pack as many containers as can fit onto a given instance. Additionally, the ALB uses a mesh routing system vs individual hosts, meaning that it does not need to be ‘pre-warmed’ and can scale automatically to meet traffic demands.
In some cases, we’re currently packing 100-200 containers per instance. It’s dramatically increased our utilization and cut the number of instances required to run our infrastructure (at the same time as we 4x’d api volume).

Utilization over time
Easy by default with Terraform
Of course, it’s easy to cut costs with these sorts of focused ‘one-time’ efforts. The hardest part of maintaining solid margins is systematically keeping costs low as your team and product scale. Otherwise, we knew we would be doomed to repeat the process in another 6 months.
To do that, we had to make the easy way, the right way. Whenever a member of the eng team wanted to add a new service, we had to ensure that it would get all of our efficiency measures for free without extra boilerplate or configuration.
That’s where Terraform comes in. It’s the configuration language we use at Segment to provision and apply changes to our production infrastructure.
As part of our efforts, we created the following modules to give our teammates a high-level set of primitives that are “efficient by default”. They don’t have to supply any extra configuration, and they’ll automatically get the following by using our modules:
-
Clusters which configures an Autoscaling Groups linked to an ECS cluster.
-
Services to setup ECS services that are exposed behind an ALB (Application Load Balancer).
-
Workers to setup ECS services that consume jobs from queues but don’t expose a remote API.
-
Auto-Scaling as a default behavior for all hosts and containers running on the infrastructure.
If you’re curious about how they fit together, you can check out our open-sourced version on Github: The Segment Stack. It contains all of these pieces out of the box, and will soon support per-service autoscaling automatically.
Takeaways
After being in the weeds for three months, we managed to hit our goal. We eliminated over $1m dollars in annual spend off our AWS bill. And managed to increase our average utilization by 20%.
While we hoped to share some insights behind a few of the very specific issues we encountered in our effort to reduce costs, there are a few bigger takeaways that should be useful for anyone looking to increase the efficiency of their infrastructure:
Efficient By Default: It’s important that efficiency efforts aren’t just a rule book or a one-time strategy. While cost management does requires ongoing vigilance, the most important investment is to prevent problems from occurring in the first place. The easy-mode should be efficient. We accomplished this by providing an environment and building blocks in Terraform that made services efficient by default.
However, this extends beyond configuration tools, and includes picking infrastructure that simplifies capacity planning. S3 is notoriously great at this: it requires zero up-front capacity planning. When considering a SQL database, where the team may have picked MySQL or PostgreSQL, consider using something like Amazon’s Aurora. Aurora automatically scales disk capacity in 10GB increments, eliminating the need to plan capacity ahead of time. After this project efficiency became our default, and is now part of how our infrastructure is planned.
Auto-scaling: During this effort we found that auto-scaling was incredibly important for efficiency, but not only for the obvious reason of scaling along with demand. In practice, engineers would configure their service to give them a few months of headroom before they had to re-evaluate their capacity allocation. This meant that services were actually being allocated far above their weekly peak requirements. That configuration itself is often imperfect, and wastes precious engineering time tuning these settings. At this point, we’d say that ubiquitous auto-scaling is a practical requirement for a micro-services architecture. It’s relatively easy to manage capacity for a monolithic system, but with dozens of services, this becomes a nightmare.
Elbow Grease: There are some tools that aid with cloud efficiency efforts, but in practice it requires serious effort from the engineering team. Don’t fall for vendor hype. Only you know your systems, your requirements, your financial objectives, and thus the right trade-offs to make. Tools can make this process easier, but they’re no magic bullet.
For any growing startup, cost management is a discipline that has to be built over time. And like security, or policies, it’s often far easier to institute the earlier you start measuring it.
Now that all is said and done, we’re glad cost-management and measurement is a muscle we’ve started exercising early. And it should continue to have compounding effects as we continue to scale and grow.
Test drive Segment CDP today
It’s free to connect your data sources and destinations to the Segment CDP. Use one API to collect analytics data across any platform.