6 Best Web & Data Analytics Tools for 2021 (+How to Choose)
A data analytics tool is essential to make insights accessible and make better decisions. Make the most of your data with the right tool for the job.
A data analytics tool is essential to make insights accessible and make better decisions. Make the most of your data with the right tool for the job.
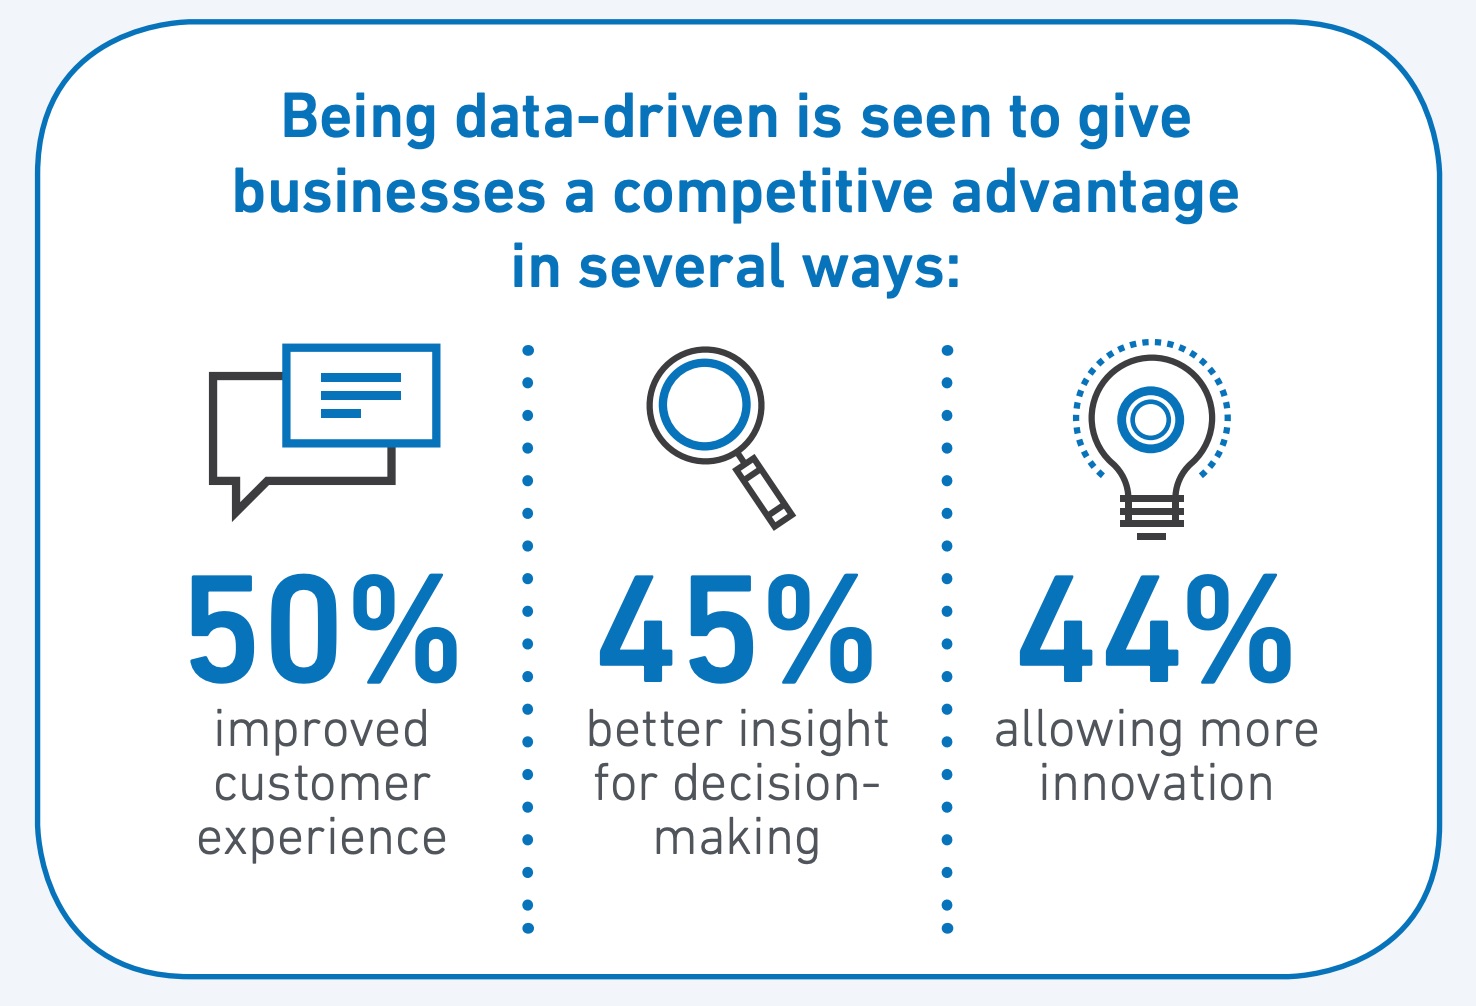
Teams that make the most of their data have a significant competitive edge. Eighty-five percent of companies think that data is “one of their most valuable assets,” according to Experian. By leveraging data, companies see 50% better customer experience, 45% improved insight for decision-making, and 44% more innovation.

The question is, how can companies make data accessible to the right teams so they can act on those insights?
A data analytics tool will make insights accessible so everyone can make better decisions faster. There’s no one-size-fits-all approach to choosing the best data analytics tool. Before you settle on one, understand your options so you can choose the best data analytics tool for your business needs.
Table of contents
A data analytics tool is software that’s used to collect and analyze large amounts of user data to identify trends and predict user behavior.
To use data analytics software, you install a tracking library on your website, mobile app, or servers to record data. The data analytics tool can then track events such as sessions, entry and exit points, a video view, or an item added to a cart.
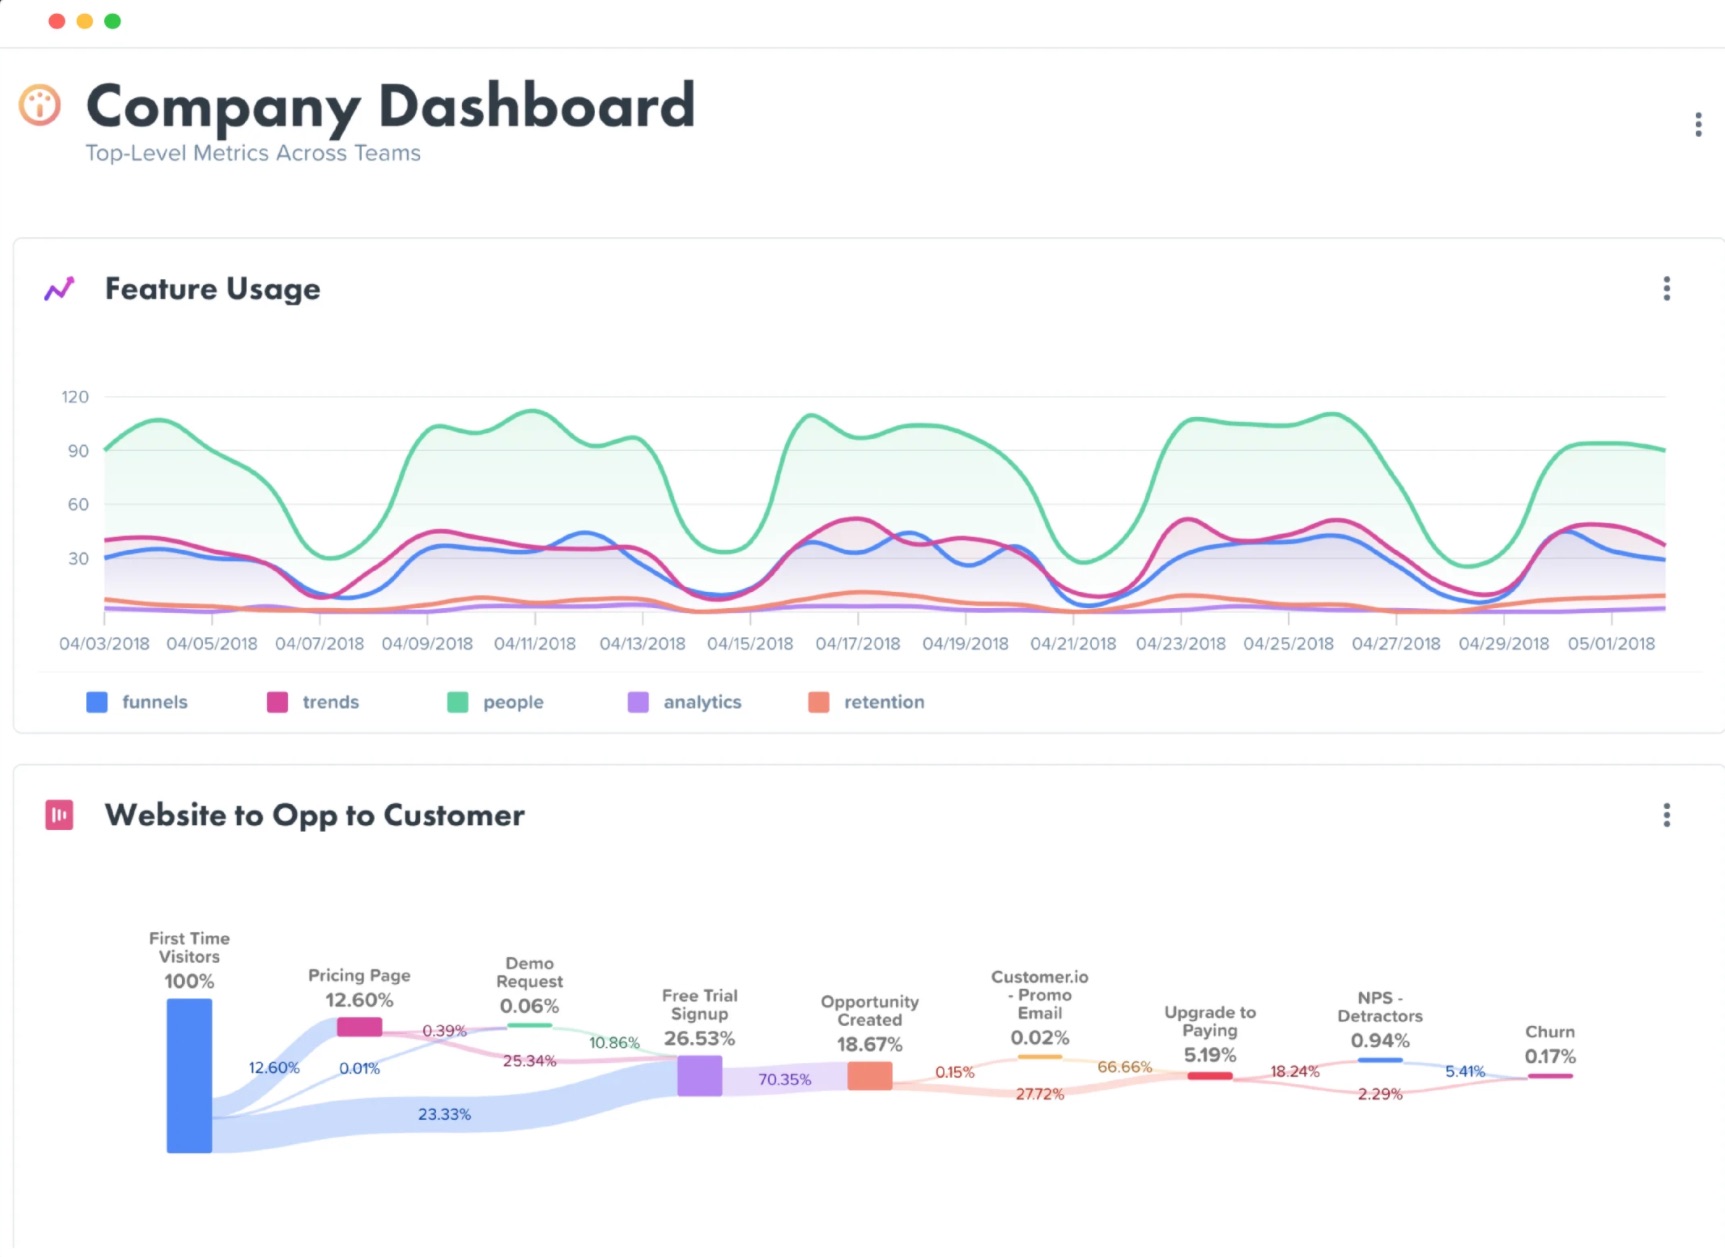
By analyzing user behavior, product teams can determine which features keep users engaged and identify potential friction or drop-off points in the user flow. With a data analytics tool, you’ll be able to correlate things like time spent in an app when using a particular feature to determine engagement. If customers aren’t taking an expected action, you can identify drop-off points and then make feature improvements to encourage that action.
Marketers can use data analytics tools to optimize their efforts by gaining insight into which channels drive the most (and the most valuable) website visitors, and creating behavioral marketing campaigns to target users based on specific behaviors. You can establish which pages on your website bring the most revenue, A/B test which CTA brings the most newsletter sign-ups, or see the most popular entry and exit points. Segmentation can be used to define user groups and create more targeted marketing campaigns.
Data analytics tools are an investment, so you don't want to choose blindly. If your team uses the wrong tool, you won't gain actionable insights, and you'll struggle to meet customer expectations. Consider these two key dimensions to develop your criteria to find the best data analytics tool for your business.
While all data analytics platforms offer basic reporting capabilities, many have features that are better suited to certain goals than others.
For example, if your focus is to personalize marketing efforts, you’ll benefit from software like Mixpanel, with predictive analytics to identify users who are most likely to convert. Then you can double down on your efforts to reach the right people and minimize time spent on these efforts.
If you want to enhance user experience and increase retention, a tool that provides insights into user paths and drop-off points, like Amplitude, provides a clear picture of product health.
Have these goals top of mind when considering your options so you can see how the tool functions for your use case.
Many data analysis tools offer tiered pricing plans for your data collection. Lower tiers, designed for small to mid-market companies, limit the number of total monthly users, user sessions, user actions, or web properties that can be tracked.
Higher tiers accommodate the massive amounts of data enterprises typically see. Enterprise providers often have machine-learning algorithms for mining large amounts of data quickly.
Now that you know what you need your data analytics tool to do, it’s time to consider the options on the market. All of these tools integrate with Segment. With this integration, your data analytics tool will have full access to clean, standardized data that your team can trust.
Google Analytics is a widely adopted platform typically used to report and gain insight into essential website metrics and KPIs. Small and medium-sized businesses can use it for free. For enterprises, Google Analytics 360 is a paid version that is optimal for analyzing high data volumes. It has advanced tools, like custom metrics and AI-powered funnel reporting and attribution modeling.
Top features:
Integrate seamlessly with all of Google's cloud offerings
Streamline configuration of complex tracking with tag management tools
Access real-time data on web traffic and users
Return answers to natural language queries
Import interaction data from third-party systems for Google Analytics 360
Ideal for:
Objectives: Increase conversion rates, enhance user experience, drive LTV, optimize marketing efforts
Roles: Marketers, product managers
Industries: Marketing and advertising, technology, media, commerce, travel
Company size: Small to mid-market for free plan; larger mid-market and enterprise for Google Analytics 360
Adobe Analytics is a robust, highly customizable analytics suite that provides multichannel web and marketing analytics. It's typically used by mid-market and enterprise companies with many data sources and large datasets. It's less appropriate for startups that only need basic analyses.
Top features:
Identify new audience groups with sophisticated segment-building and machine-learning models
Transform data with advanced tools for analysts and data scientists
Collect and process data from virtually any channel — online and offline, email, video, search, display, and more
Predict customer's likelihood to convert or churn with powerful data science processes
Ideal for:
Objectives: Identify new audiences, increase conversion rates, enhance user experience, drive LTV, optimize marketing efforts, improve site performance
Role: Marketers, product managers, developers
Industries: Mid-market to enterprise
Company size: Ecommerce, marketing and advertising, media, travel, financial services, technology
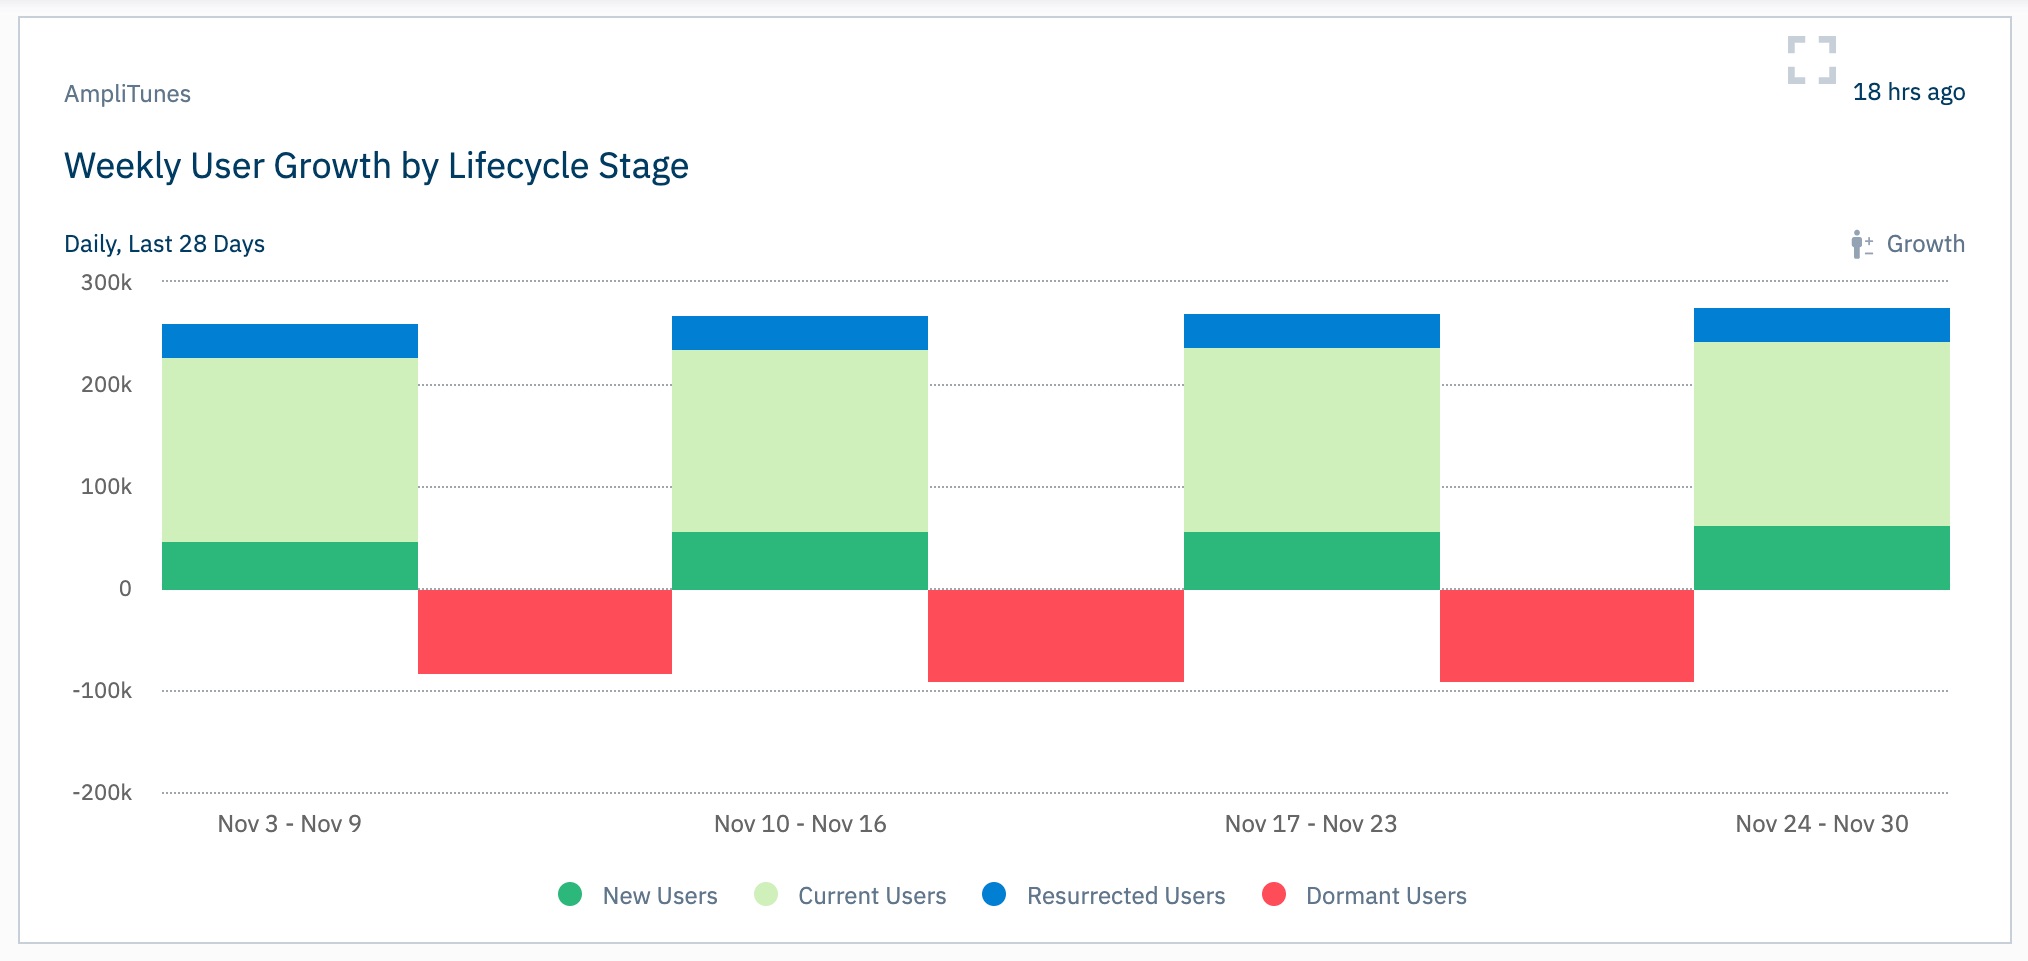
Amplitude is one of the best web analytics tools to help product managers understand the user journey and improve retention rates by identifying the best- and worst-performing features. It provides insights into common user paths, drop-off points, and features correlated with increased retention. Marketers can use Amplitude to create targeted campaigns, as well as for A/B testing. An intuitive interface and customizable dashboards help teams gain insights faster.

Top features:
Get a clear picture of product health, including engagement, funnels, cohort retention, and revenue
Funnel audiences by custom events and actions
Focus on customers who create the highest ROI through product changes with account-level analytics and CRM-integration for B2B companies
Ideal for:
Objectives: Enhance user experience, drive LTV
Role: Product managers, marketers
Industries: Technology, media, ecommerce, financial services, B2B
Company size: Mid-market to enterprise
Mixpanel provides web and in-app event tracking to help marketers improve conversion and retention rates. Its advanced segmentation abilities allow you to dive deeper to uncover trends associated with engagement and retention. It even recommends actions to improve these metrics.
Top features:
Create segments automatically to identify high- and low-performing user groups, new target audiences, etc.
Pinpoint ways to improve engagement with predefined "Insight" questions
Enable more targeted and proactive marketing with predictive analytics
A/B test app features, colors, copy, and images within Mixpanel
Ideal for:
Objectives: Increase conversion rates, drive LTV, optimize marketing efforts
Roles: Marketers, product managers, developers
Industries: Technology, media, financial services
Company size: Small to mid-market
Kissmetrics is a web and mobile engagement platform that connects behavioral analytics with powerful email automation. It delivers simple, valuable reporting of customer behavior across devices with precision segmentation and targeting options. Kissmetrics is great for identifying the characteristics of different customer cohorts so you can market to them effectively.
Top features:
Create automatic or manual targeted email campaigns based on custom events or funnels
Identify and monitor custom audience growth segments with cross-platform behavior reports
Integrate with ecommerce platforms to import shopping history
Ideal for:
Objectives: Increase conversion rates, drive LTV
Role: Marketers
Industries: Ecommerce, marketing and advertising, media, travel
Company size: Small to mid-market
Woopra is a real-time analytics platform that monitors how users behave across product, marketing, sales, and support touchpoints. It's intuitive and easy to implement. It delivers both a high-level analysis of how different user groups move through the funnel, as well as detailed information on individual user journeys to assist customer success teams.

Top features:
See a detailed picture of user interactions with cross-platform integrations like CRM, mobile, email, social media, and support tools
Reveal critical obstacles and opportunities at every point in the customer experience, from marketing campaigns to product engagement
Monitor product performance across multiple dimensions and identify features that drive long-term revenue
Ideal for:
Objectives: Increase conversion rates, enhance user experience, drive LTV, optimize marketing efforts
Role: Marketers, product managers, customer success representatives
Industries: Ecommerce, technology, media, travel, financial services
Company size: Small to mid-market
This list is just the tip of the iceberg. While we reviewed a few key data analytics solutions in the ecosystem, there are many data analytics tools to choose from. Keen.io is an ideal solution for developers who want a highly customizable, technical tool. Flurry is a great free option for startup app companies that want basic reporting.
Browse more data analytics options in the Analytics section of our integrations catalog.
The last thing you need is another tool that silos information and slows down workflows. By using a customer data platform, like Segment, you can level up the impact of using a data analytics tool, improve business intelligence efforts, and empower your organization to make informed, data-driven decisions.
Segment sits between data sources (like your website, email marketing, and data warehouse) and the destinations you want to utilize your data (like advertising, customer success, and data analytics tools).
By using Segment, you will maximize the functionality of your data analytics tools and ensure they have access to all relevant information, not just some of it.
New to Segment?
Sign up for a demo to learn how Segment can help you better understand your customers and engage with them effectively.

Our annual look at how attitudes, preferences, and experiences with personalization have evolved over the past year.